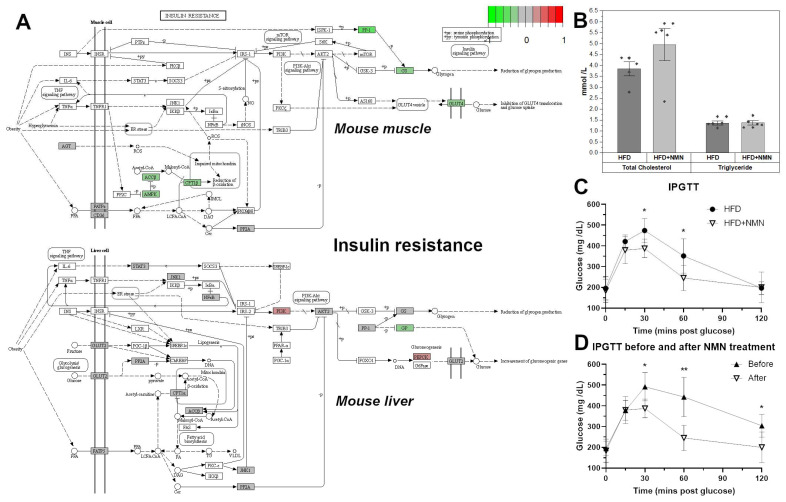
Figure 1.
C57BL/6J mice develop severe glucose uptake deficiency on high-fat diet (HFD). (A) NMN treatment effects on the KEGG insulin resistance pathway in mouse muscle and liver. The color of the boxes represents the log2 fold change of the protein abundances, represented for HFD + NMN group versus HFD group. Red: upregulated; green: downregulated; grey: no significant expression change. GS and GLUT4 are significantly downregulated in muscle tissue of treated mice. (B) Serum total cholesterol and triglycerides in HFD and HFD + NMN-treated mice, 7 days after treatment. (C) intraperitoneal glucose tolerance test (IPGTT) in HFD and HFD + NMN-treated mice after 7 days. (D) IPGTT in HFD + NMN-treated mice before and after NMN treatment. The data are illustrated as average values of the groups (n = 5) ± standard deviation of the mean (STDEV) and statistical significance between HFD and HFD + NMN groups. * p < 0.05; ** p < 0.01.

