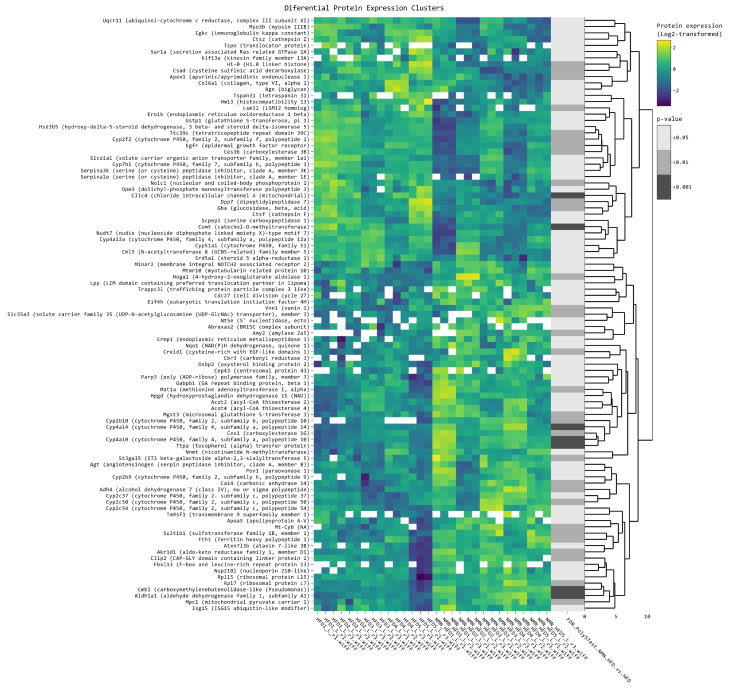
Figure 2.
Clustered heatmap of the differentially expressed proteins in mouse liver. Clustered heatmap of the 103 differentially expressed proteins in mouse liver tissue, filtered with log2FC threshold set to exclude the interval −0.3, 0.3, p < 0.05. Yellow color represents upregulation, while blue represents downregulation. From left to right, expression values (log2 transformed) for replicates (5 biological × 3 technical) are shown for the HFD group and for the HFD + NMN-treated group, followed by significance values of comparison to HFD group.

