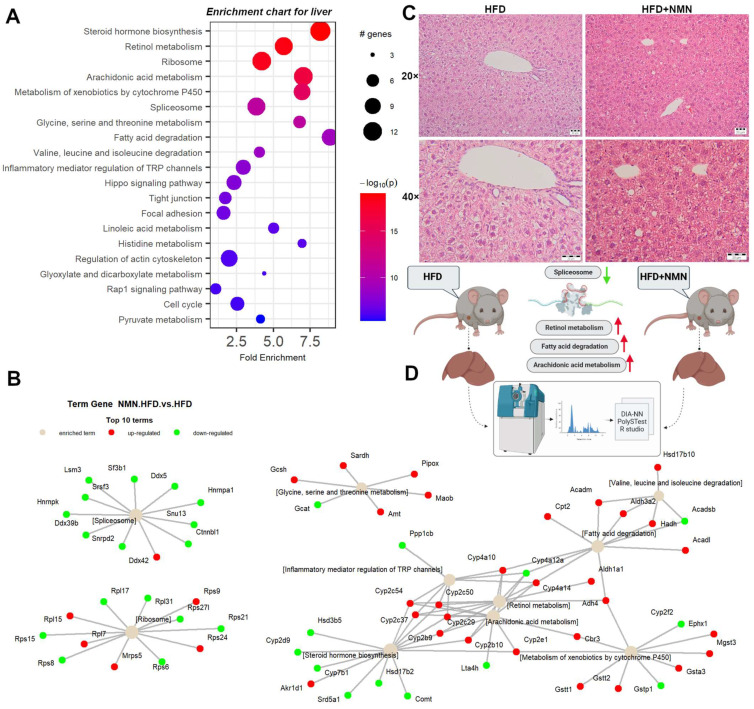
Figure 3.
Integrated proteomics data analysis of NMN-treated HFD mouse liver. (A) Enrichment chart for top 20 KEGG Pathways sorted by lowest p value. (B) Term–gene graph for top 10 terms. (C) Representative images of hematoxylin and eosin staining for mouse liver tissue. Scale bars, 20 μm. (D) Experiment summary (BioRender).

