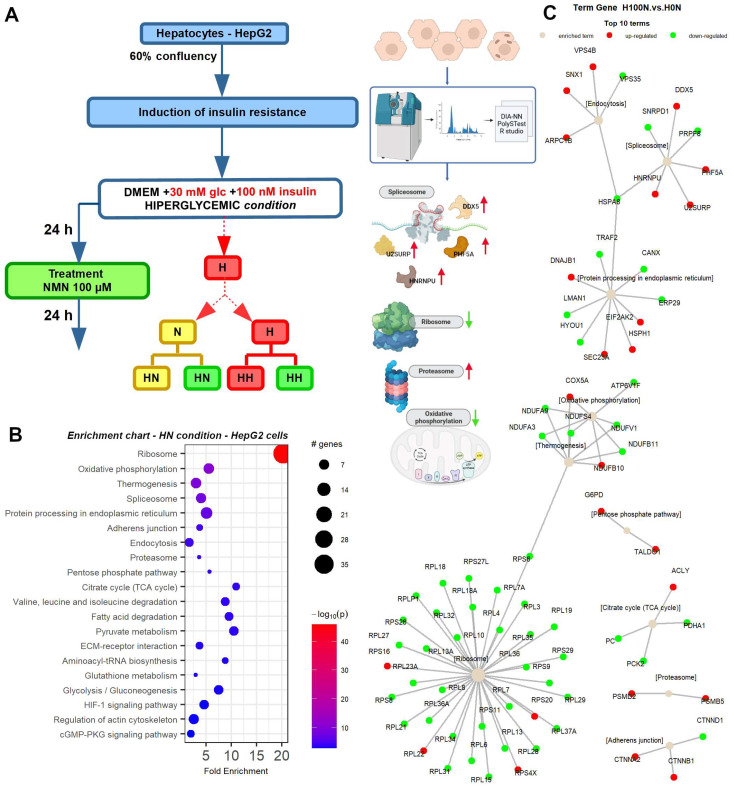
Figure 8.
Integrated proteomics data analysis of HepG2 cell line under HN conditions. (A) Experiment summary (OpenOffice, BioRender). (B) Enrichment chart for top 20 KEGG Pathways in HN conditions for HepG2 cells sorted by lowest p value. (C) Term–gene graph for top 10 terms in HN conditions for HepG2 cells.

