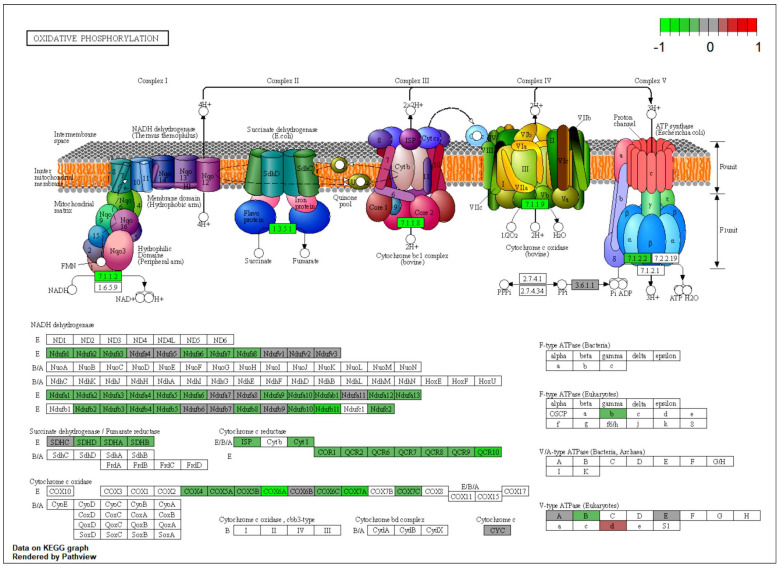
Figure 10.
NMN treatment effects on the KEGG oxidative phosphorylation pathway in mouse muscle tissue. The color of the boxes represents the log2 fold change of the protein abundances, represented for HFD + NMN group versus HFD group. Red: upregulated; green: downregulated; grey: no significant expression change.

