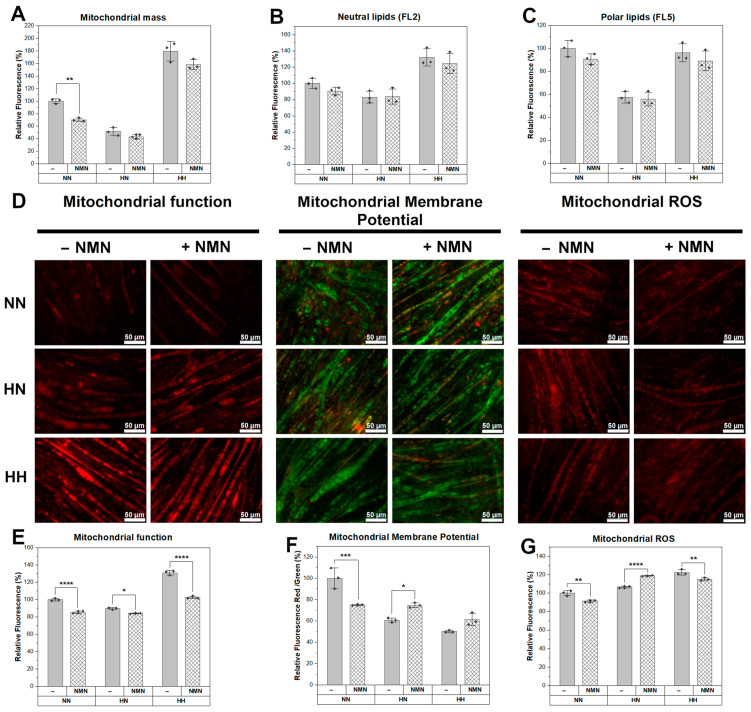
Figure A3.
NMN effects on C2C12-derived myotubes exposed to hyperglycemic conditions: neutral lipids, polar lipids, mitochondrial mass, metabolic activity, membrane potential, and reactive oxygen species (ROS). (A) Mitochondrial mass with 10-nonyl-acridine orange (NAO). (B) Neutral lipids with Nile Red (FL2). (C) Polar lipids with Nile Red (FL5). (D) Fluorescence microscopy. Scale bars, 50 μm. (E) Mitochondrial function with MitoView Red. (F) Mitochondrial membrane potential with JC-1. (G) Mitochondrial ROS with DHR-123 in C2C12 myotubes during 100 μM NMN treatment in normoglycemic conditions (NN), hyperglycemic conditions followed by culture media switch to normoglycemic conditions during NMN treatment (HN), hyperglycemic conditions before and during treatment (HH), versus untreated condition (−). The flow cytometry data are illustrated as average values of the groups (n = 3 × 15,000 events) ± standard deviation of the mean (STDEV) and statistical significance between NMN-treated and untreated conditions. * p < 0.05; ** p < 0.01; *** p < 0.001; **** p < 0.0001.

