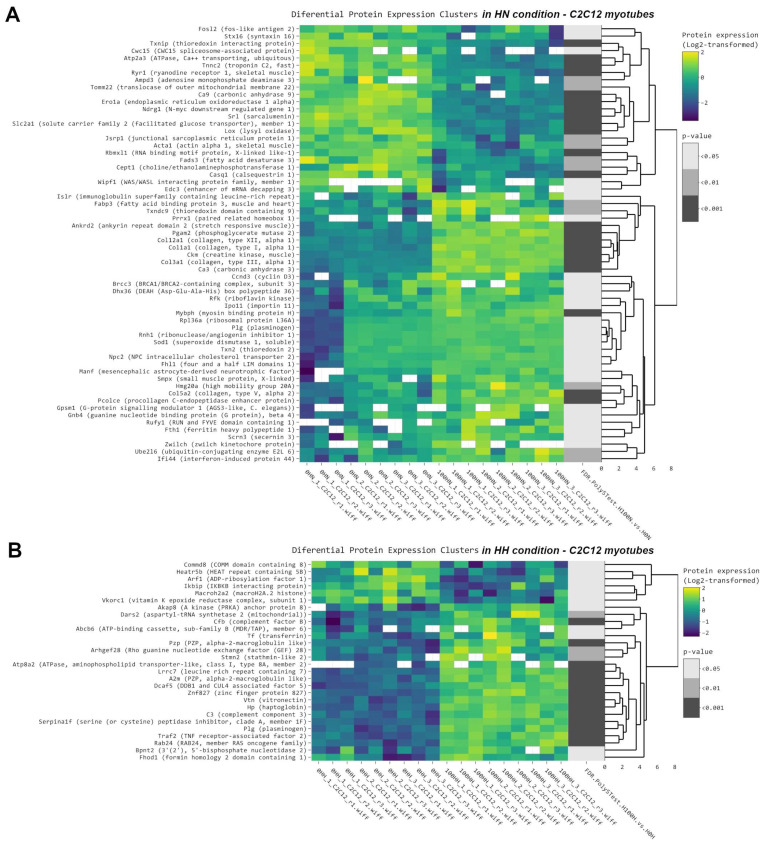
Figure A6.
Clustered heatmap of the differentially expressed proteins in myotubes. (A) Clustered heatmap of the 63 differentially expressed proteins in HN conditions, filtered with log2FC threshold set to exclude the interval −0.3, 0.3 and 0.05 p threshold. From left to right, expression values (log2 transformed) for replicates (3 biological × 3 technical) are shown for the 0HN (untreated) group and for the 100HN (treated) group, followed by significance values of the comparison to 0HN (untreated) group. (B) Clustered heatmap of the 30 common differentially expressed proteins in HH conditions, filtered with log2FC threshold set to exclude the interval −0.3, 0.3 and 0.05 p threshold. From left to right, expression values (log2 transformed) for replicates (3 biological × 3 technical) are shown for the 0HH group and for the 100HH (treated) group, followed by significance values of the comparison to 0HH (untreated) group.

