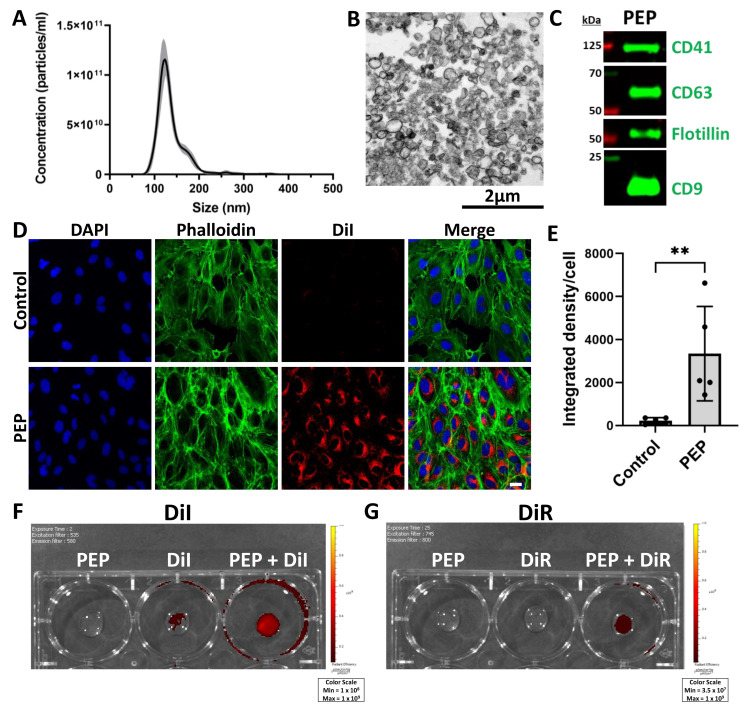
Figure 1.
Exosome characterization of PEP and membrane labeling by lipophilic dye. (A) NanoSight analysis of PEP demonstrating distribution of particle size ± standard deviation (gray shading). (n = 3). (B) Transmission electron microscopy image of PEP with scale bar 2 µm. (C) Western blot demonstrating presence of hallmark exosomal proteins CD9, CD63, and Flotillin, as well as platelet integrin CD41. (D) Immunocytochemistry of human umbilical vein endothelial cells following treatment with DiI-labeled PEP or DiI alone (control) in red, counterstained with phalloidin (green) and DAPI (blue), scale bar 20 µm. (E) Quantification (n = 5) of mean integrated density DiI per nuclei (±SD) for Figure 1D. ** p < 0.001 using Mann-Whitney two-tailed t-test. (F) Xenogen image demonstrating fluorescent signal detected in unlabeled PEP, DiI, and PEP + DiI. (G) Xenogen image demonstrating fluorescent signal detected in unlabeled PEP, DiR, and PEP + DiR.

