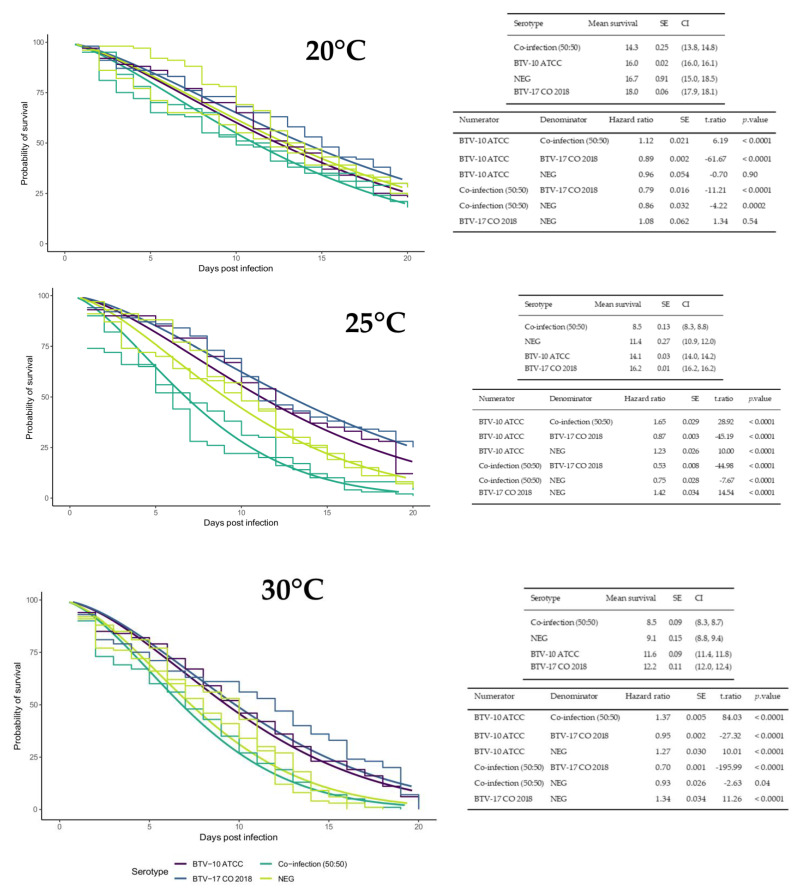
Figure 1.
Temperature and BTV infection status impacts C. sonorensis lifespan. Plots include all groups from both survival assay trials (experiment 2 and 3) with parametric survival regression models fit to each temperature separately (20 °C, 25 °C or 30 °C) with default Weibull distribution and robust sandwich error calculation. The plots consists of smooth lines for the survival regression curves of each infection group (BTV-10 in purple, BTV-17 in blue, BTV 10:BTV17 coinfected in green, and negative control in yellow) with the y-axis representing probability of survival and the x-axis representing days post infection. A Kaplan–Meier step curve is included for each group with a separate step curve for the repeated coinfected and negative control groups from experiment 3. Results are shown in associated tables that provide the mean survival days post infection, standard error (SE), and 95% confidence interval (CI) for individual curves and survival odds (Hazard ratio), SE, statistic (t.ratio), and p-value for comparisons between curves.

