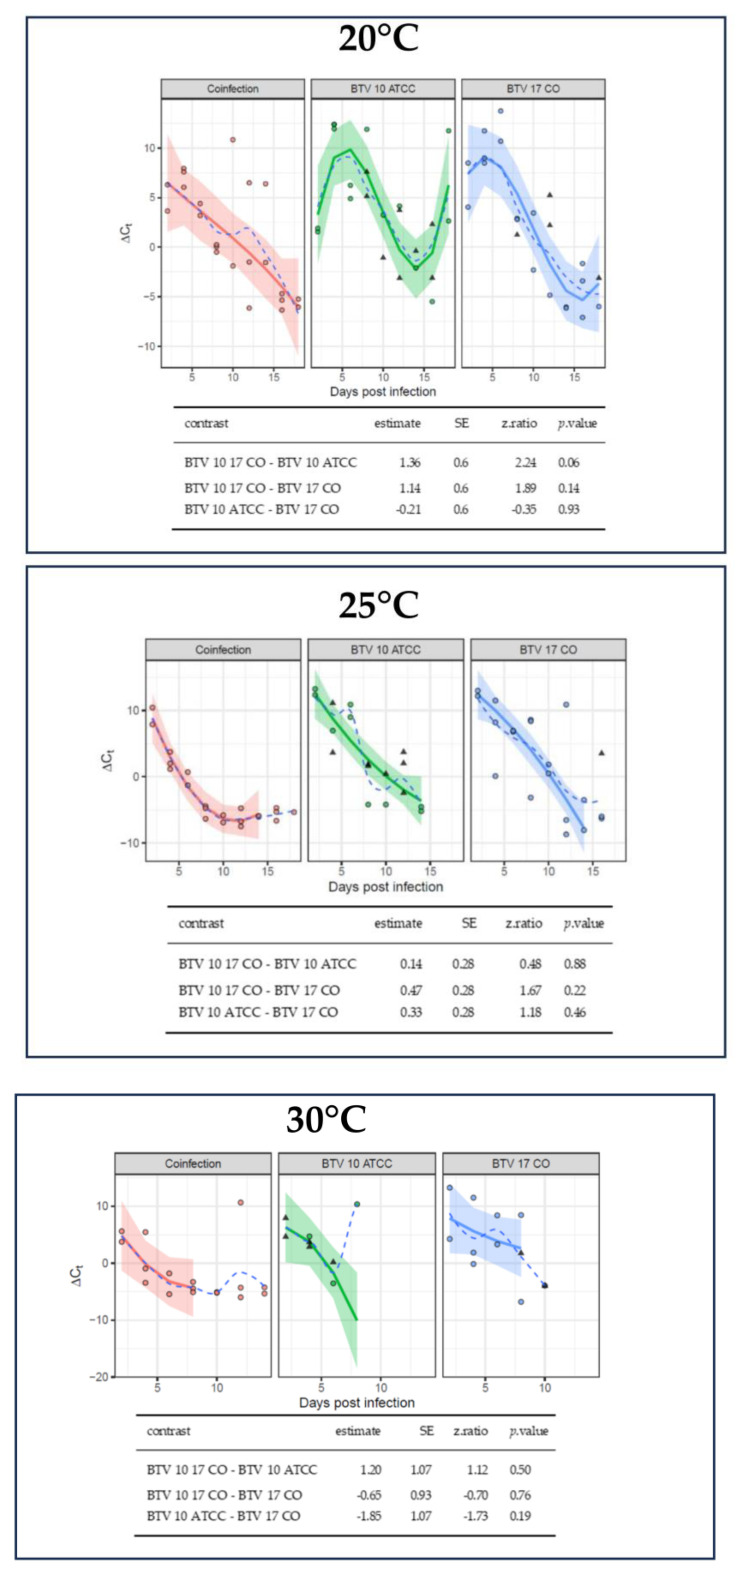
Figure 3.
BTV virogenesis is similar across infection groups. Normalization of BTV Ct values calculated for each sample was accomplished using the ∆Ct method based on mean Ct values for BTV and cox1 (i.e., Pan BTV Ct−cox1 Ct). Due to the decreased survival of C. sonorensis at higher temperatures, data collection was limited for the 30 °C collection group. A linear model was fitted to each temperature (20 °C, 25 °C or 30 °C) separately with robust linear models applied to account for outliers. Some pools did not have detectable BTV and are represented by imputed values using multivariate imputation by chained equation with a Bayesian linear regression method and represented by triangles. Circles indicates data points. A third-degree polynomial was fit to Ct values for the 20 °C plot and second-degree polynomials were fit to Ct values for the 25 °C and 30 °C plots. Solid lines indicate the model curve, the shaded region represents the standard error, and the dash line is a curve based on the mean of the data at each day post infection. Pairwise comparisons were performed on the linear portions of the curves with a Tukey HSD adjustment. Estimates of the differences in linear trends, standard error, z-ratio statistic, and p-value are given for all comparisons.

