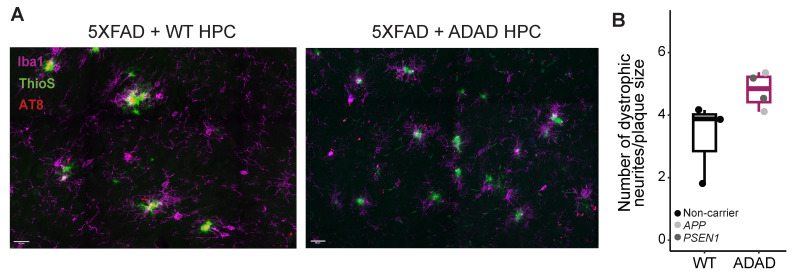
Figure 4.
Representative images, scale bar =20 μm (A) and quantification (B) of dystrophic neurites (AT8+) in the cerebral cortex of 6-month-old hCSF1 5XFAD mice xenotransplanted with WT and ADAD human microglia. Each dot represents one donor line (N = 3 WT + 4 ADAD donor lines, 1–3 xenotransplanted mice per donor line, 3 brain sections analyzed per mouse, 5 plaques quantified per section).

