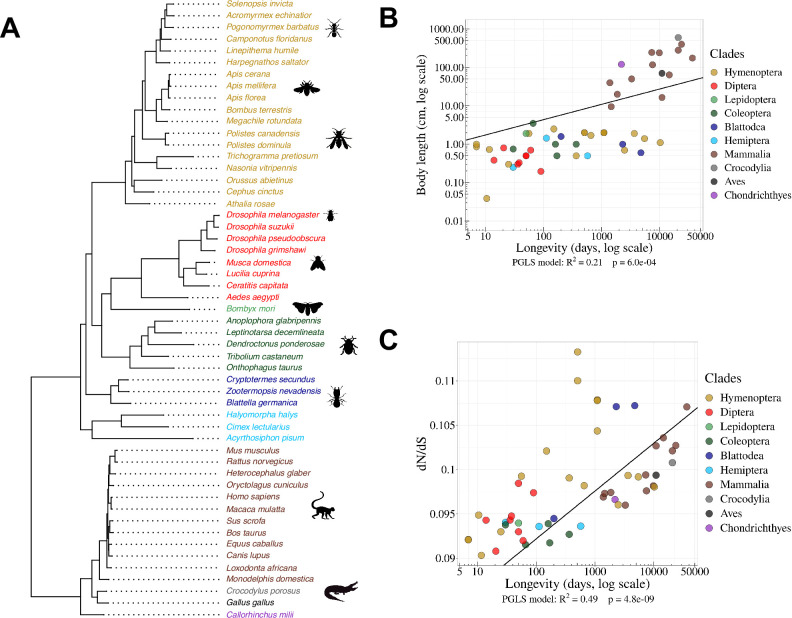
Figure 1. Species phylogeny and Ne proxies.
(A) Phylogenetic tree of the 53 studied species (15 vertebrates and 38 insects). (B) Relationship between body length (cm, log scale) and longevity (days, log scale) of the organism. Each dot represents one species (colored by clade, as in the species tree in panel A). (C) Relationship between longevity (days, log scale) and the ratio on terminal branches of the phylogenetic tree (Materials and methods). (B,C) PGLS stands for Phylogenetic Generalized Least Squared regression, which takes into account phylogenetic inertia (Materials and methods).

