. 2024 Mar 12;13:RP93629. doi: 10.7554/eLife.93629

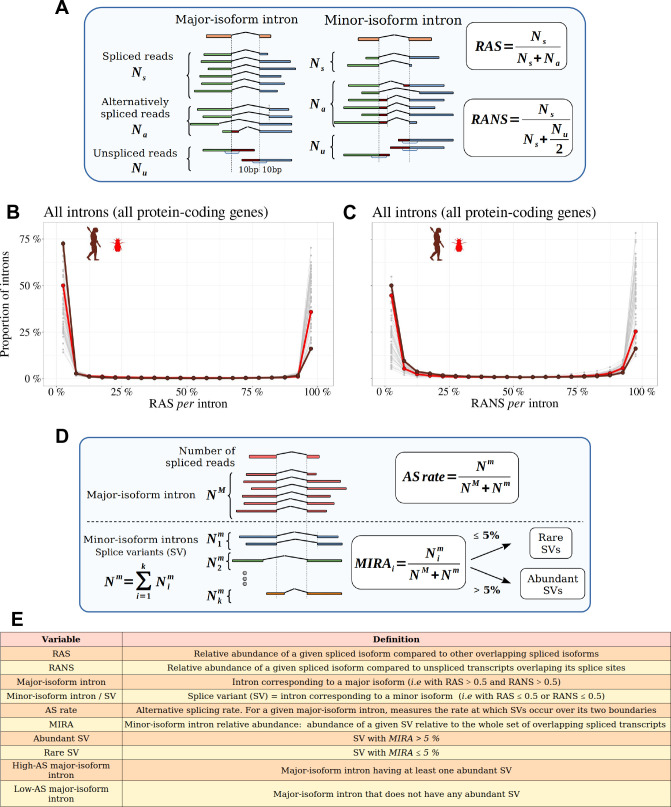
Figure 2. Distinguishing major and minor-isoform introns and measuring the rate of alternative splicing.

(A) Definition of the variables used to compute the relative abundance of a spliced isoform compared to other transcripts with alternative splice boundaries (RAS) or compared to unspliced transcripts (RANS): Ns: number of spliced reads corresponding to the precise excision of the focal intron; Na: number of reads corresponding to alternative splice variants relative to this intron (i.e. sharing only one of the two intron boundaries); Nu: number of unspliced reads, co-linear with the genomic sequence. (B,C) Histograms representing the distribution of RAS and RANS values (divided into 5% bins), for protein-coding gene introns. Each line represents one species. Two representative species are colored: Drosophila melanogaster (red), Homo sapiens (brown). (D) Description of the variables used to compute the AS rate of a given a major-isoform intron, and the ’minor-isoform intron relative abundance’ (MIRA) of each of its splice variants (SVs): NM: number of spliced reads corresponding to the excision of the major-isoform intron; Nim: number of spliced reads corresponding to the excision of a minor-isoform intron (i); Nm: total number of spliced reads corresponding to the excision of minor-isoform introns. (E) Definitions of the main variables used in this study.

Figure 2.

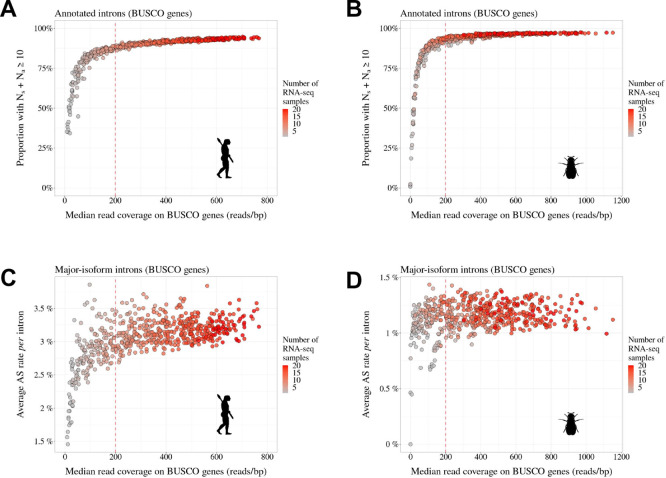
Figure 2—figure supplement 1. Transcriptome sequencing depth affects intron detection power and AS rate estimates.

Figure 2—figure supplement 1.

To assess the impact of sequencing depth on AS detection, we conducted a pilot analysis with two species (A,C: Homo sapiens and B,D: Drosophila melanogaster) for which hundreds of RNA-seq samples are available (; refer to Data10-supp.tab in the Zenodo data repository). We randomly drew 1–20 RNA-seq samples and, for each draw, we computed the median read coverage across BUSCO gene exons (to get a measure of transcriptome sequencing depth that is comparable across species). We also computed for each draw the average AS rate and the fraction of introns supported by at least 10 RNA-seq reads, out of all introns annotated for BUSCO genes (Materials and methods). We repeated this procedure 30 times. As expected, the fraction of BUSCO introns that are supported by at least 10 reads (i.e. Ns+Na10) increases with sequencing depth (A,B). More importantly, we observed that when sequencing depth is limited, the mean AS rate of BUSCO introns is very variable across draws (C,D). However, AS rate estimates converge when sequencing depth exceeds 200. We therefore kept for further analysis those species for which the median read coverage across exonic regions of BUSCO genes was above this threshold.
Figure 2—figure supplement 2. The power to detect AS events is positively correlated with transcriptome sequencing depth.
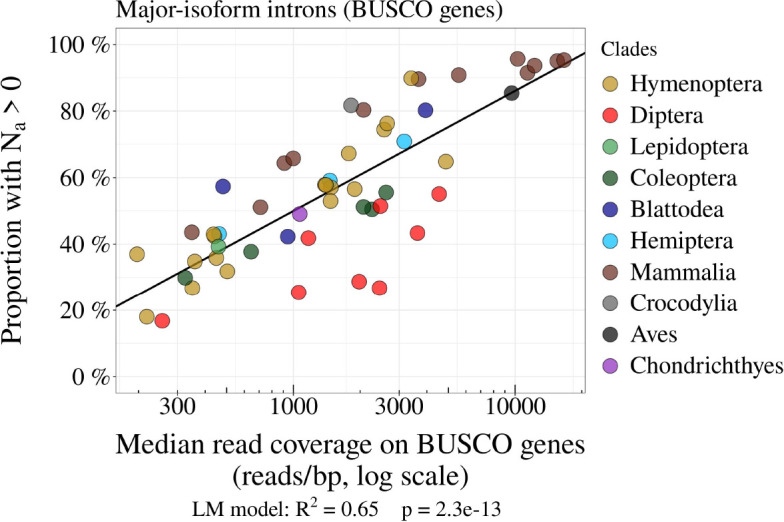
Figure 2—figure supplement 2.

Relationship between the proportion of major-isoform introns that have at least one read corresponding to splice variants (i.e.Na>0; see Figure 2), and the median per-base read coverage computed on BUSCO gene exons, across metazoans. Each dot represents one species, colored by taxonomic clade.
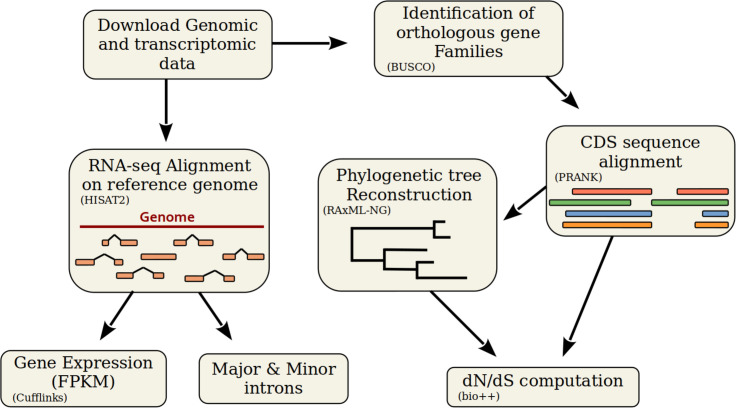
Figure 2—figure supplement 3. Description of the bioinformatic analyses pipeline.

Figure 2—figure supplement 3.

First, we retrieved genomic sequences and annotations from the NCBI Genomes database. We aligned RNA-seq reads with HISAT2 on the corresponding reference genomes, to analyze various variables (see Figure 2), to compute the AS rate, and to estimate gene expression using Cufflinks. To compute dN/dS, we first identified BUSCO genes with BUSCOv3 and aligned their coding sequences (CDS) using PRANK (codon model). We reconstructed a phylogenetic tree using RAxML-NG with 461 multiple alignments. Using bio++, we estimated dN/dS along the phylogenetic tree on concatenated alignments.