. 2024 Mar 12;13:RP93629. doi: 10.7554/eLife.93629

Figure 3. The rate of alternative splicing correlates with life history traits across metazoans.

(A) Relationship between the per intron average AS rate of an organism and its longevity (days, log scale). (B) Variation in average AS rate across seven organs (brain, cerebellum, heart, liver, kidney, testis, and ovary) among seven vertebrate species (RNA-seq data from Cardoso-Moreira et al., 2019). AS rates are computed on major-isoform introns from BUSCO genes (Materials and methods).

Figure 3.

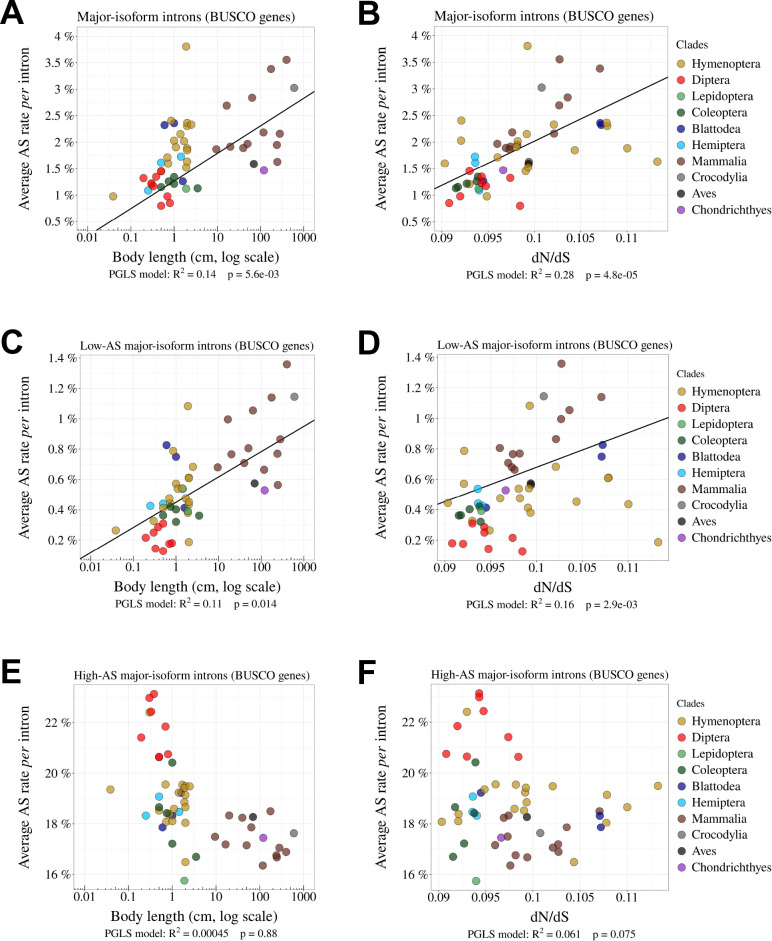
Figure 3—figure supplement 1. Relationship between AS rates and other Ne proxies.

Figure 3—figure supplement 1.

(A, B) Correlation between the average AS rate per intron and the body length of each species (cm, log scale) (A) or the dN/dS ratio on terminal branches of the phylogenetic tree (B). (C, D, E, F) Relationship between the average AS rate per intron and the body length (cm, log scale) (C, E) or the dN/dS ratio (D, F). (C, D) Low-AS major-isoform introns (i.e. major-isoform introns that do not have any abundant SV). (E, F) High-AS major-isoform introns (i.e. major-isoform introns having at least one abundant SV). Only BUSCO genes were used in the analysis.
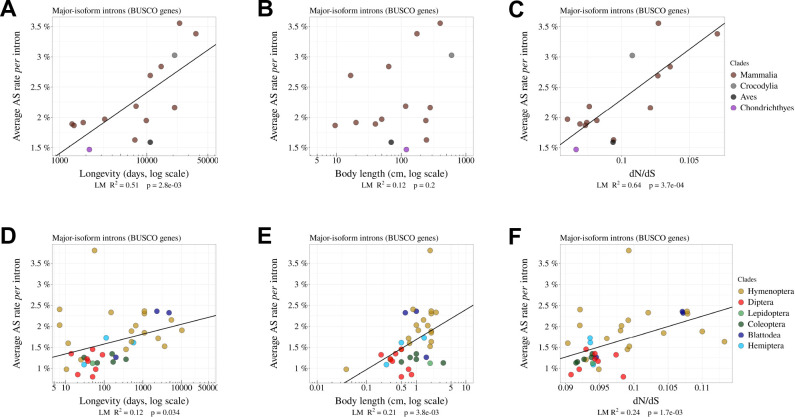
Figure 3—figure supplement 2. The rate of alternative splicing correlates with life history traits in both vertebrates and insects.

Figure 3—figure supplement 2.

Correlation between the average AS rate per intron and longevity of each species (days, log scale) (A, B), body length (cm, log scale) (B, E), or the dN/dS ratio on terminal branches of the phylogenetic tree (C, F). In vertebrates (A, B, C) and insects (C, D,E). Only the BUSCO genes were included in the analysis.
Figure 3—figure supplement 3. The variation in AS rates between species is not explained by organ differences.
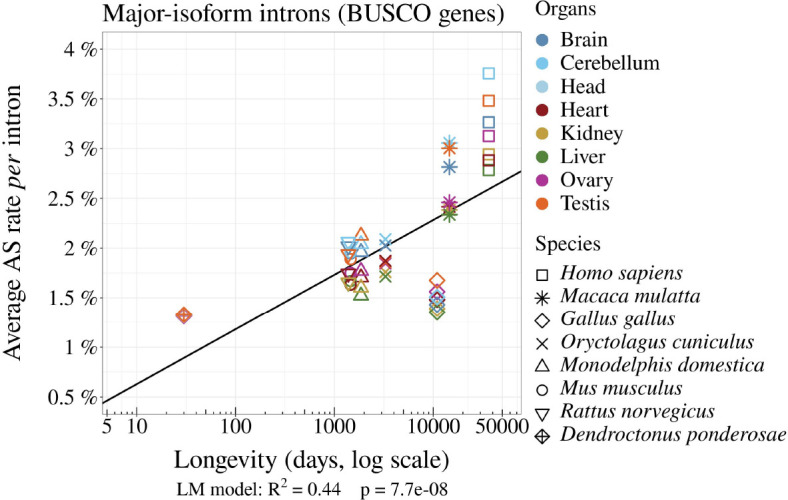
Figure 3—figure supplement 3.

Variation in average AS rate across seven organs (brain, cerebellum, heart, liver, kidney, testis, and ovary) among seven vertebrate species (RNA-seq data from Cardoso-Moreira et al., 2019) and across three organs (ovary, testis, and head) for one insect (Dendroctonus ponderosae, Coleoptera). AS rates were computed for the major-isoform introns from BUSCO genes (Materials and methods).
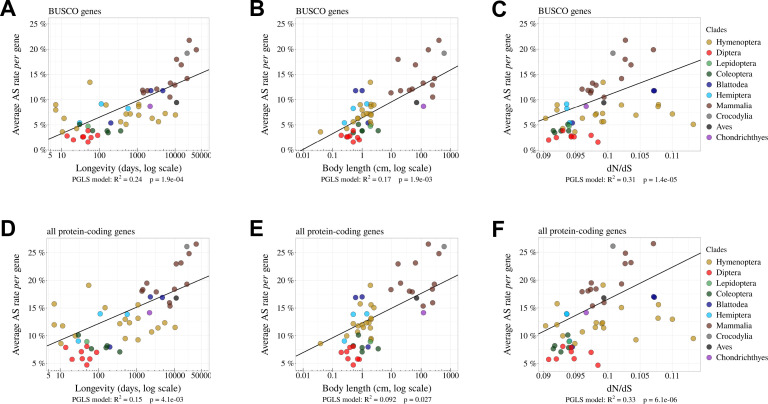
Figure 3—figure supplement 4. The per-gene AS rate is negatively correlated with Ne.

Figure 3—figure supplement 4.

Relationship between per-gene average AS rates and Ne proxies. We use as inverse Ne proxies the longevity (days, log scale) (A, D) or the body length (cm, log scale) (B, E) or the dN/dS ratio (C, F). The analysis was done on BUSCO genes (A, B, C) and on all protein-coding genes (D, E, F).