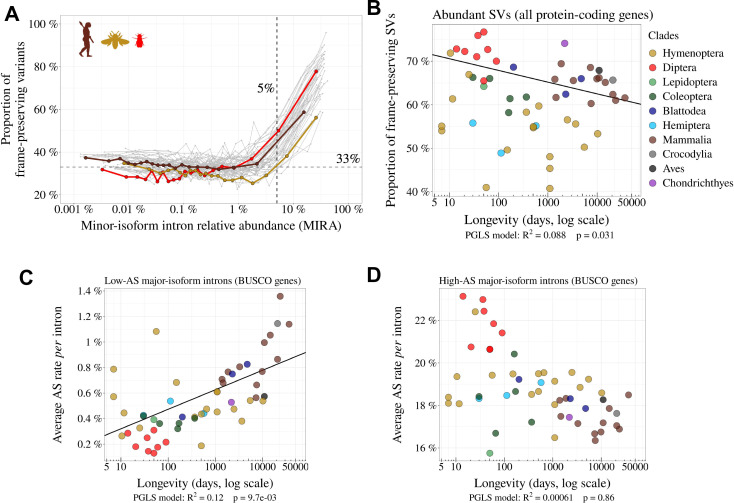
Figure 4. Variation in AS rate across metazoans: distinguishing abundant splice variants (enriched in functional variants) from rare splice variants.
(A) Frame-preserving isoforms are strongly enriched among abundant splice variants (SVs). For each species, SVs were classified into 20 equal-size bins according to their abundance relative to the major isoform (MIRA, see Materials and Methods), and the proportion of frame-preserving SVs was computed for each bin. Each line represents one species. Three representative species are colored: red: Drosophila melanogaster, brown: Homo sapiens, yellow: Apis mellifera. We used a threshold MIRA value of 5% to define ‘abundant’ vs. ‘rare’ SVs. (B) Proportion of frame-preserving SVs among abundant SVs across metazoans. Each dot represents one species. All annotated protein-coding genes are used in the analysis. (C,D) Relationship between the average per intron AS rate of an organism and its longevity (days, log scale). Only BUSCO genes are used in the analysis. (C) Low-AS major-isoform introns (i.e. major-isoform introns that do not have any abundant SV), (D) High-AS major-isoform introns (i.e. major-isoform introns having at least one abundant SV).


