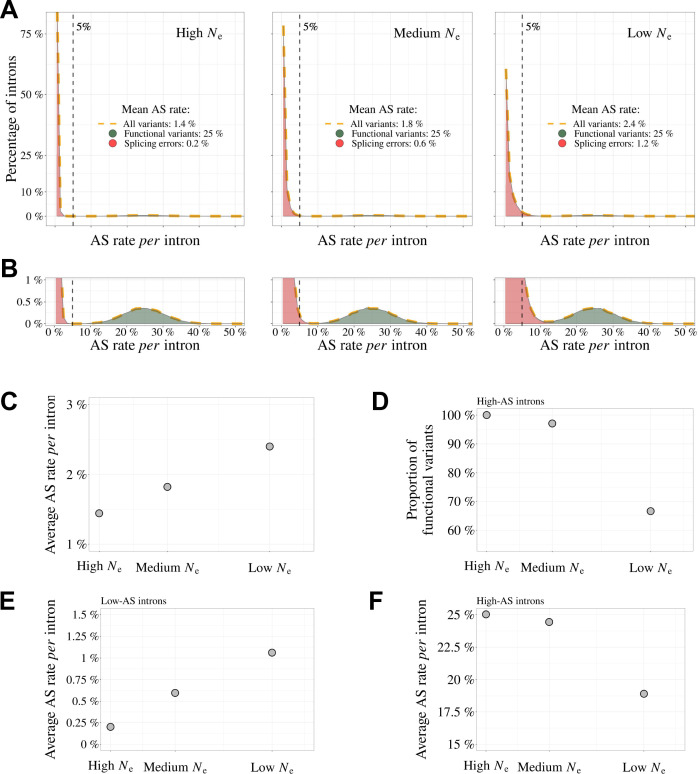
Figure 7. Impact of the drift-barrier on the genome-wide AS rate: model predictions.
To illustrate the impact of the drift barrier, we sketched a simple model, with three hypothetical species of different Ne. In this model, the repertoire of SVs consists of a mixture of functional variants and splicing errors. We assumed that in all species, only a small fraction of major-isoform introns (5%) produce functional SVs, but that these variants have a relatively high AS rate (average = 25%, standard deviation = 5%; see Materials and methods for details on model settings). Splicing error rates were assumed to be gamma-distributed, with a low mean value. Owing to the drift barrier effect, the mean error rate was set to vary from 0.2% in species of high Ne to 1.2% in species of low Ne (these parameters were chosen to match approximately the AS rates observed in empirical data for rare SVs). (A) Genome-wide distribution of AS rates in each species (high Ne, medium Ne and low Ne). Each distribution corresponds to a mixture of functional SVs (green) and splicing errors (red). (B) Zoom on the y-axis to better visualize the contribution of functional SVs to the whole distribution: rare SVs (AS ≤ 5%) essentially correspond to splicing errors, while abundant SVs (AS > 5%) correspond to a mixture of functional and spurious variants, whose relative proportion depend on Ne. The following panels show how these different distributions, induced by differences in Ne, impact genome-wide AS patterns. (C) Relationship between the average AS rate per major-isoform intron and Ne. (D) Fraction of frame-preserving splice variants among introns with high AS rates vs Ne. Relationship between the average AS rate per intron and Ne, for ‘low-AS’ major-isoform introns (MIRA ≤ %) (E), and for ‘high-AS’ major-isoform introns (MIRA > 5%) (F).

