Figure 3.

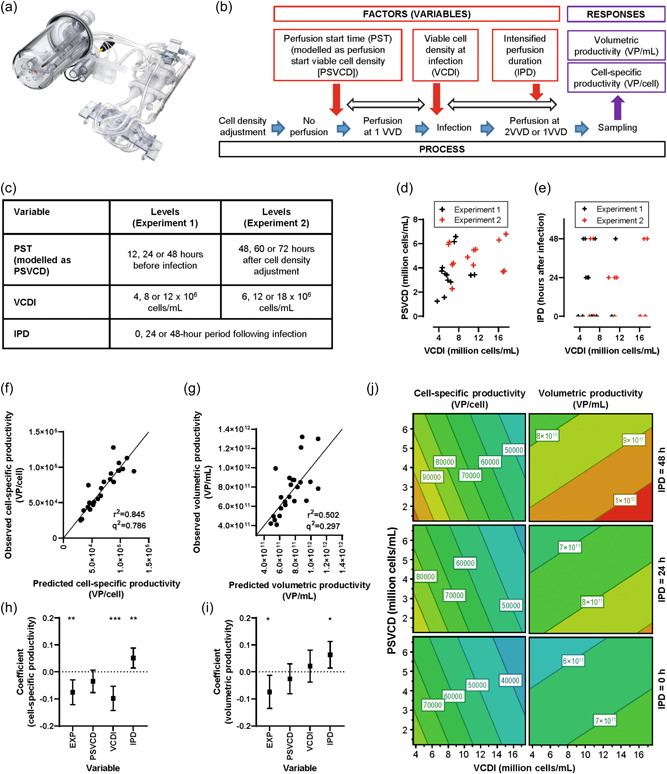
High‐throughput assessment of perfusion parameters on productivity. (a) Ambr250 perfusion bioreactor system, with perfusion unit for medium exchange via alternating tangential‐flow filtration. (b) Experimental design showing the three factors tested as independent variables and the two responses tested as dependent variables. (c) High, low, and center‐point levels for each variable in experiments 1 and 2. (d, e) Multivariate regression model parameter space for the three variables across each bioreactor in experiment 1 (black) and experiment 2 (red); note that PST is converted to PSVCD for modeling because of the different way in which PST was triggered in the two experiments. (f, g) Scatter plots of observed versus predicted values assessing model goodness of fit for the two productivity response variables; diagonals show lines of identity. (h, i) Modeled coefficients for the four factors for each of the two productivity response variables; bars show 95% confidence intervals. (j) Contour plots of modeled productivity, with the “experiment” factor held constant at the mean, illustrating relative effects on the responses across the ranges of the variables but not representing predictions; modeled values are likely to be particularly unreliable beyond the experimental design space. *p < 0.05, **p < 0.01, ***p < 0.001 (t test vs. null hypothesis of parameter coefficient being zero). EXP, experiment; IPD, intensified perfusion duration; PST, perfusion start time; PSVCD, perfusion starting at a viable cell density; VCDI, viable cell density at infection; VPs, viral particles; VVD, vessel volume(s) per day.
