
Figure 1.
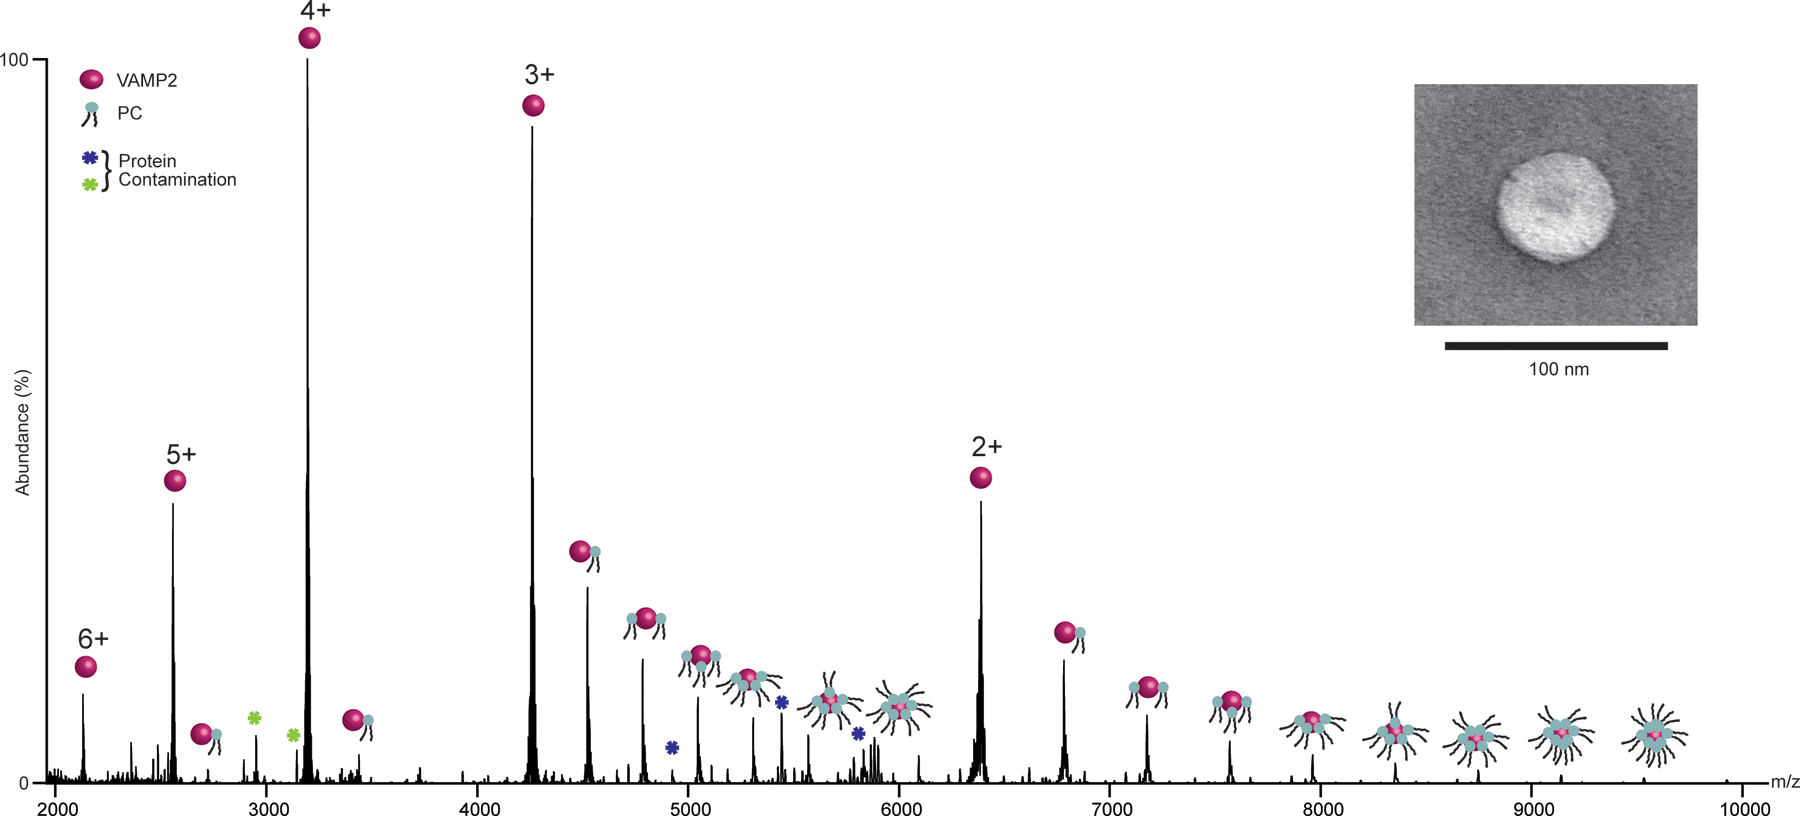
(a) nMS spectra of VAMP2 in 100%DOPC liposomes. The spectra show distinct charge state distribution from 6+ to 2+, with bound DOPC. Inset shows the negative stain EM image of the liposome.
Official websites use .gov
A
.gov website belongs to an official
government organization in the United States.
Secure .gov websites use HTTPS
A lock (
) or https:// means you've safely
connected to the .gov website. Share sensitive
information only on official, secure websites.
(a) nMS spectra of VAMP2 in 100%DOPC liposomes. The spectra show distinct charge state distribution from 6+ to 2+, with bound DOPC. Inset shows the negative stain EM image of the liposome.