
Figure 3.
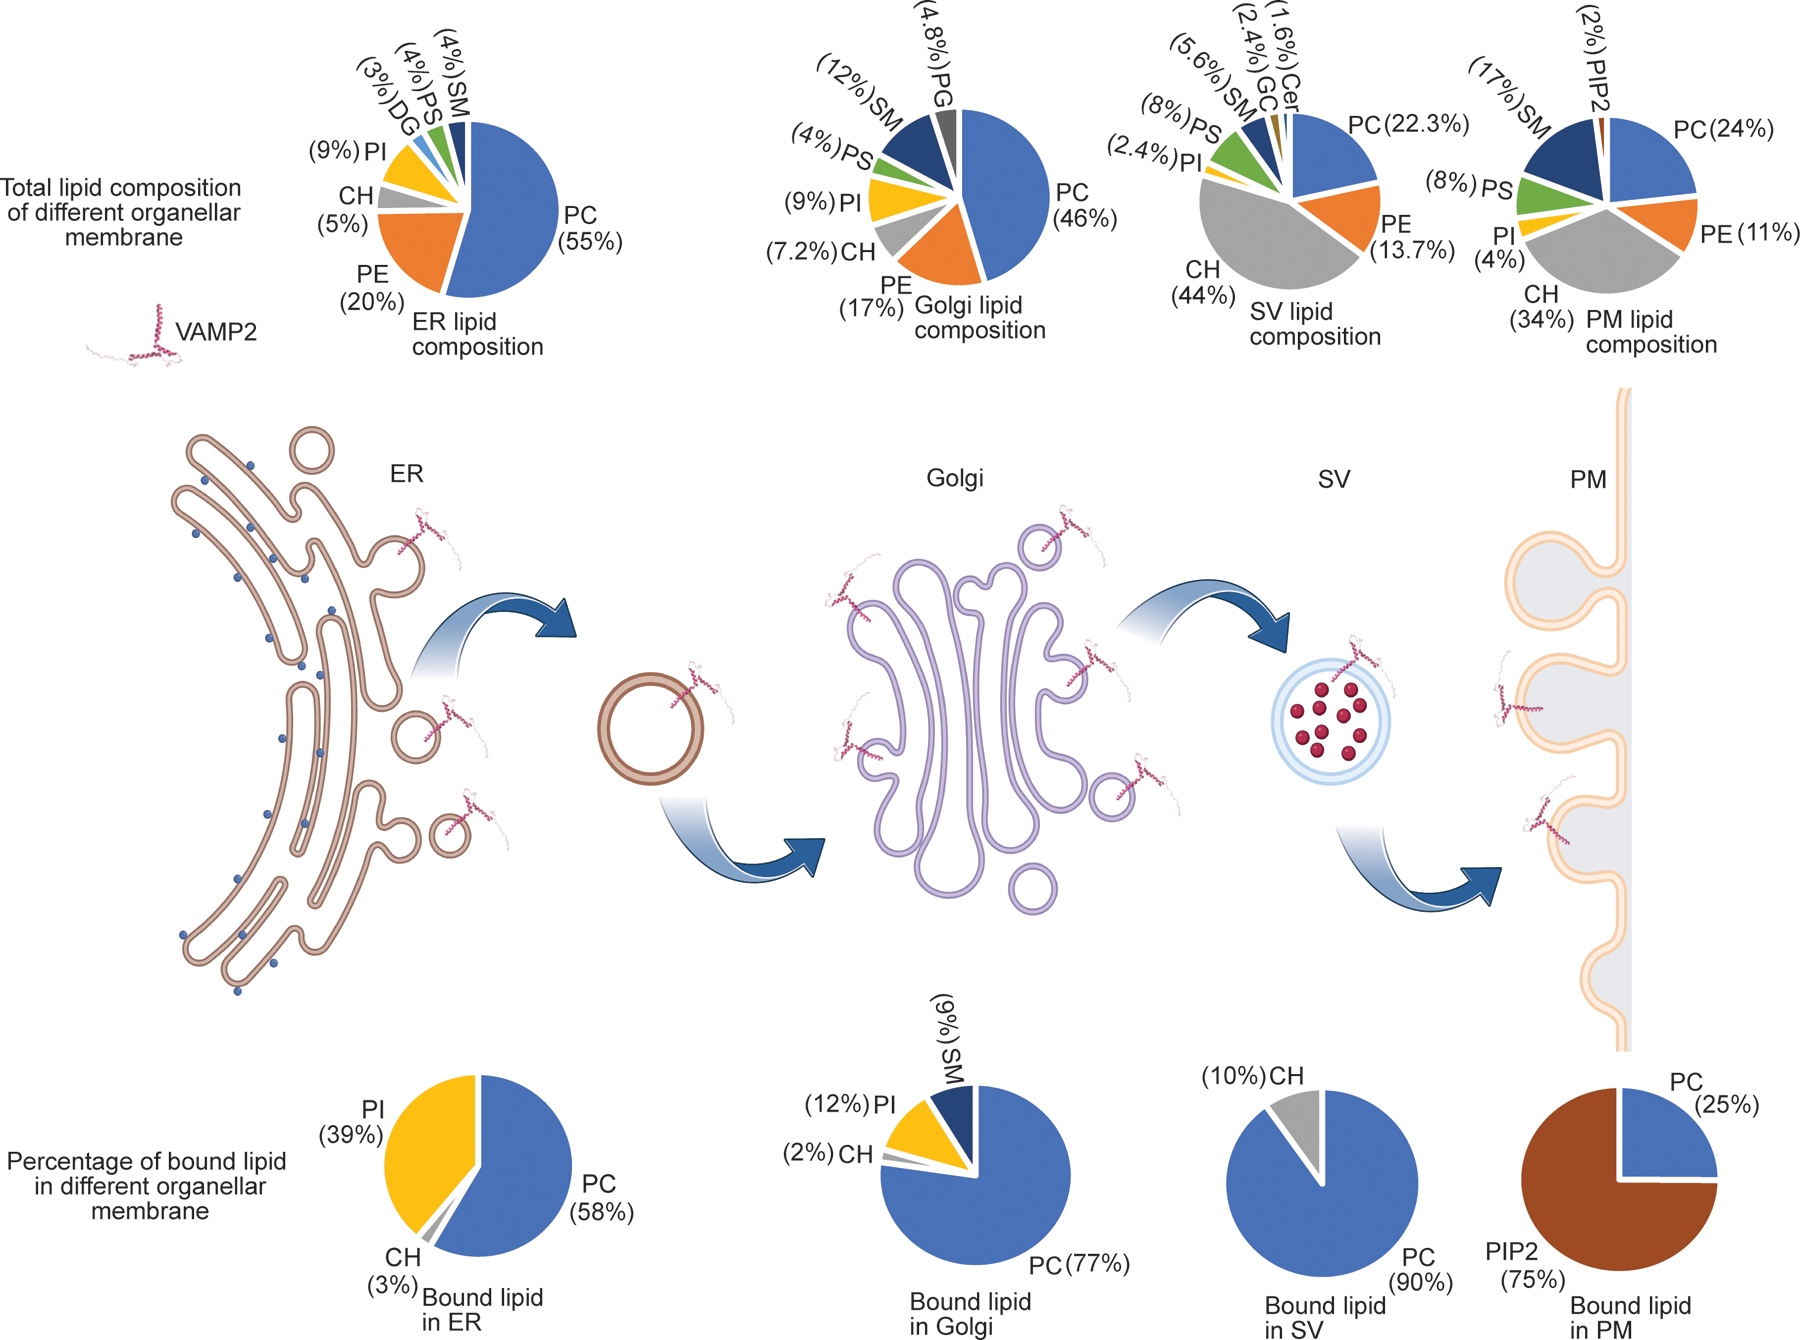
Summary of lipid binding to VAMP2 in different organellar mimic liposomes. For each organelle, the pie chart above shows the lipid composition of the liposomes in mole%, whereas the pie chart below shows lipids that bind to VAMP2 in that organelle and their relative binding percentage. The total lipid bound VAMP2 is normalized to 100% for each organelle. The data highlights how the same membrane protein can bind to a different set of lipids, with different specificity, in different organellar membranes.