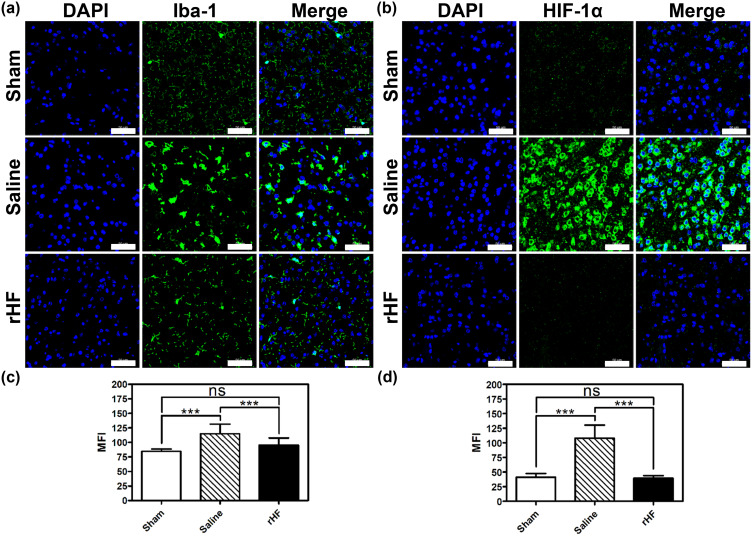
Figure 6.
Microglia activation and oxygen homeostasis-related protein expression in the brain of MCAO mice after different treatments. Iba-1 (a) and HIF-1α (b) expression in brain sections from different treatment groups examined by IF staining (n = 3), Scale bar = 50 μm. The mean fluorescence intensity (MFI) of Iba-1+ cells (c) and HIF-1α+ cells (d) in IF images analyzed with Image J (n = 15); ***P < 0.001.

