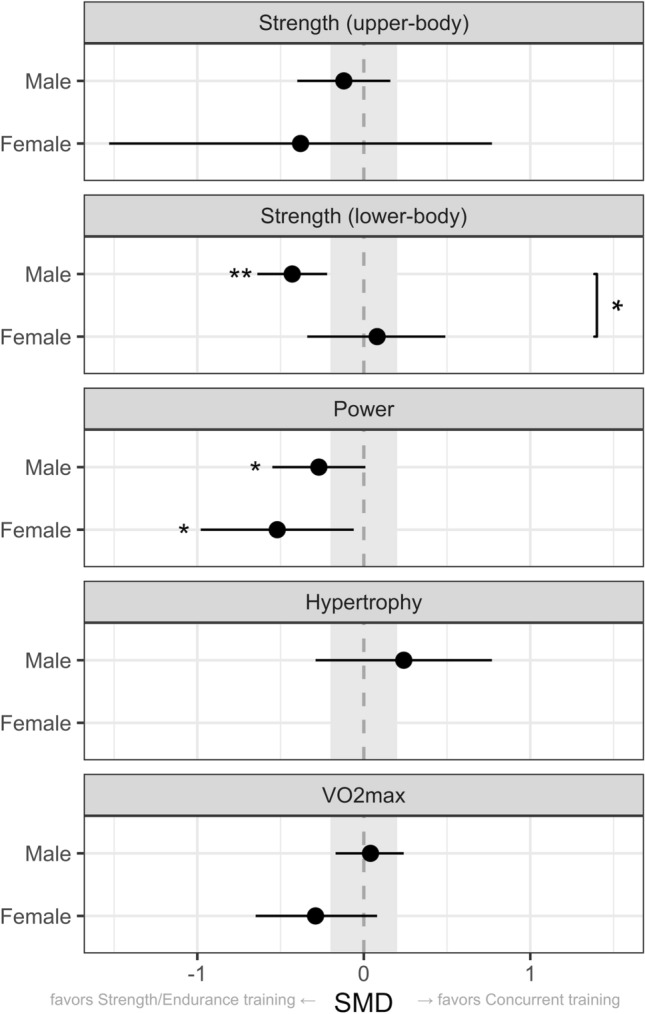
Fig. 4.

Point range plot demonstrating differences in the effects of concurrent training between males and females for each outcome measure. Effects are reported as the average standardized mean difference (SMD) and their 95% confidence intervals. The gray area highlights the smallest worthwhile change (SMD = 0.2), illustrating what effects can be considered to be non-trivial. Significant effects of concurrent training versus control are reported for males and females separately (next to point range). Significant sex differences were also reported (on the right). *P < 0.05. CI confidence interval; SMD standardized mean differences
