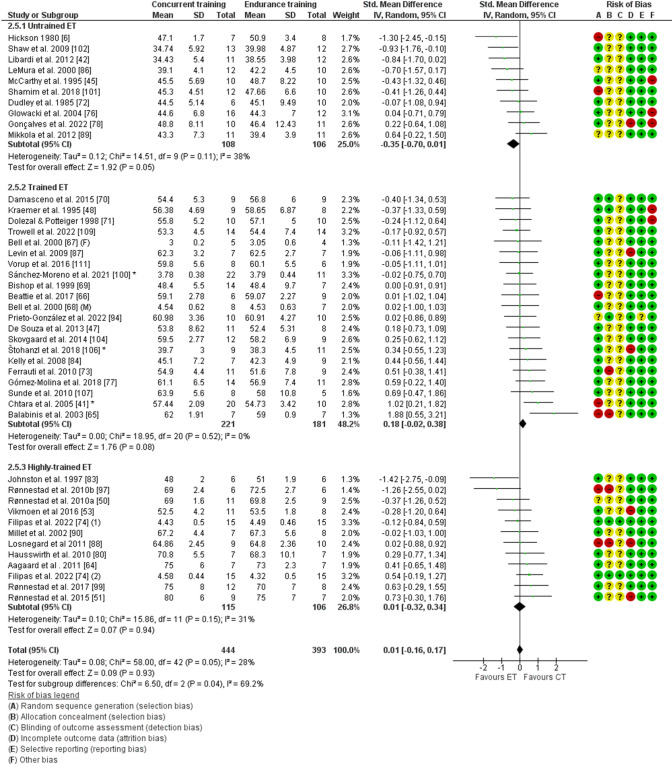
Fig. 6.
Forest plot of studies comparing differences in adaptations in maximal oxygen consumption with concurrent training between untrained, trained, and highly trained endurance athletes. Risk of bias elements are highlighted in the legend below the forest plot and bias was indicated as low (green), unclear (yellow), or high (red). * reflects studies with multiple concurrent training groups that were combined. CI confidence interval, CT concurrent training group, ET endurance training-only control group, SD standard deviation, Std. standard

