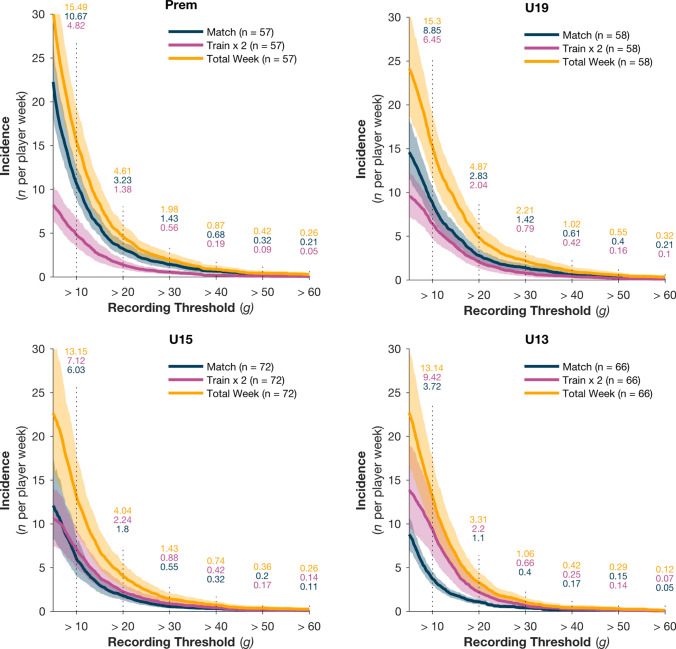
Fig. 3.
Cumulative head acceleration event (HAE) incidence rate per player week for one match (blue), two training sessions (purple) and combined (yellow) across four playing grades: Premier (Prem), Under-19 (U19), U15 and U13 (a–d, respectively). The solid line represents the mean incidence rate and shading represents the 95% confidence interval. HAE incident rates per peak linear acceleration magnitude band (10–60 g) are indicated by the numbers above each vertical line

