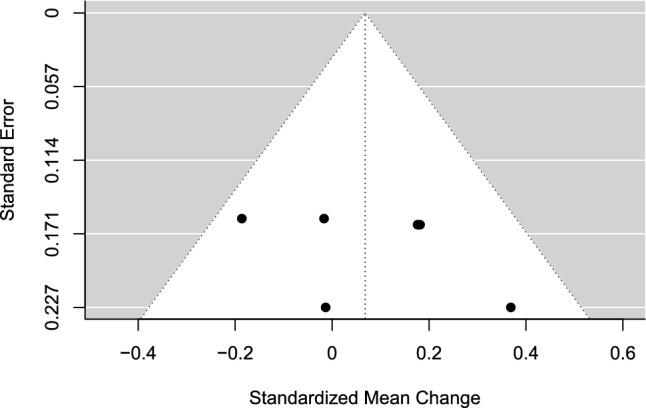
Fig. 11.

Funnel plot for meta-analysis V: regulatory focus instructions, prevention vs promotion. Black dots are individual effect sizes with the standardized mean change on the x-axis and the standard error of the effect sizes on the y-axis. The dashed vertical line represents the summary effect size estimate in the meta-analysis model. Positive standardized mean change values favor a prevention instruction and negative standardized mean changes favor a promotion instruction on the performance outcome. The plot does not account for the fact that some effect sizes are dependent because of being clustered within the same study
