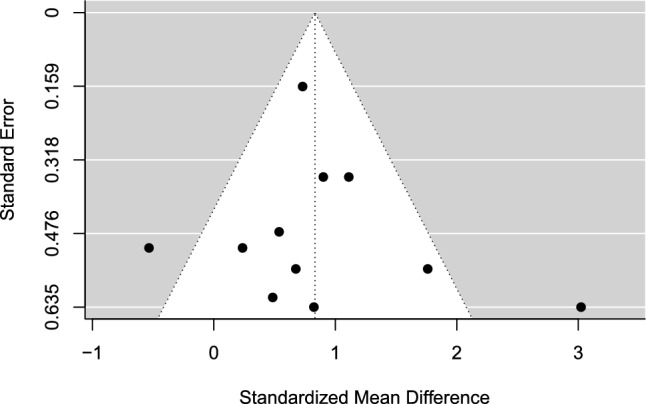
Fig. 3.

Funnel plot for meta-analysis I: multimodal psychological skills training versus control. Black dots are individual effect sizes with the standardized mean difference (Hedges’ g) on the x-axis and the standard error of the effect sizes on the y-axis. The dashed vertical line represents the summary effect size estimate in the meta-analysis model. Positive standardized mean difference values favor psychological skills training and negative standardized mean differences favor controls for the performance outcome. The plot does not account for the fact that some effect sizes are dependent because of being clustered within the same study
