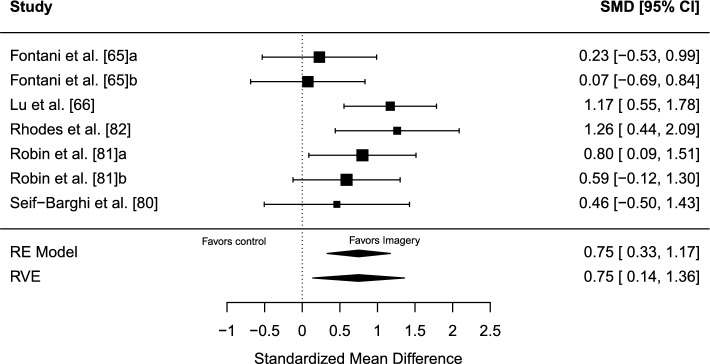
Fig. 6.
Forest plot for meta-analysis III illustrating the effect of imagery on sport performance outcomes in athletes in comparison to controls. Effect sizes are the standardized mean difference (SMD [Hedges’ g]) with a 95% confidence interval (CI). Black squares are individual effect sizes and the square size represent the relative weight. Black rhombuses are the summary effect size estimate for the random-effect (RE) model with model-based variance estimates and with robust variance estimates (RVE). a and b are separate performance outcomes in the same study

