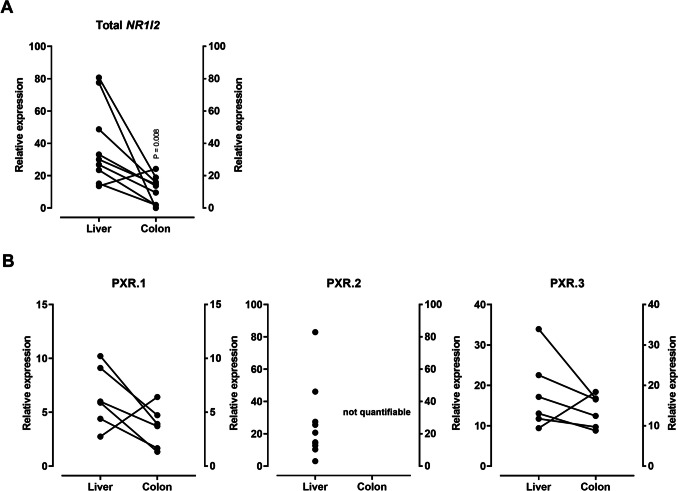
Fig. 5.
Relative mRNA expression of total NR1I2 (A) or its splice variants (B) in matched samples of healthy liver and colon. Data points shown are the mean relative expression of each sample, evaluated by two technical replicates (PCR runs). Statistical significance was evaluated by non-parametric Wilcoxon matched-pairs signed-rank test. Samples with unreliable housekeeping gene expression or outliers identified by ROUT testing (Q-level at 1%) were excluded from the analysis

