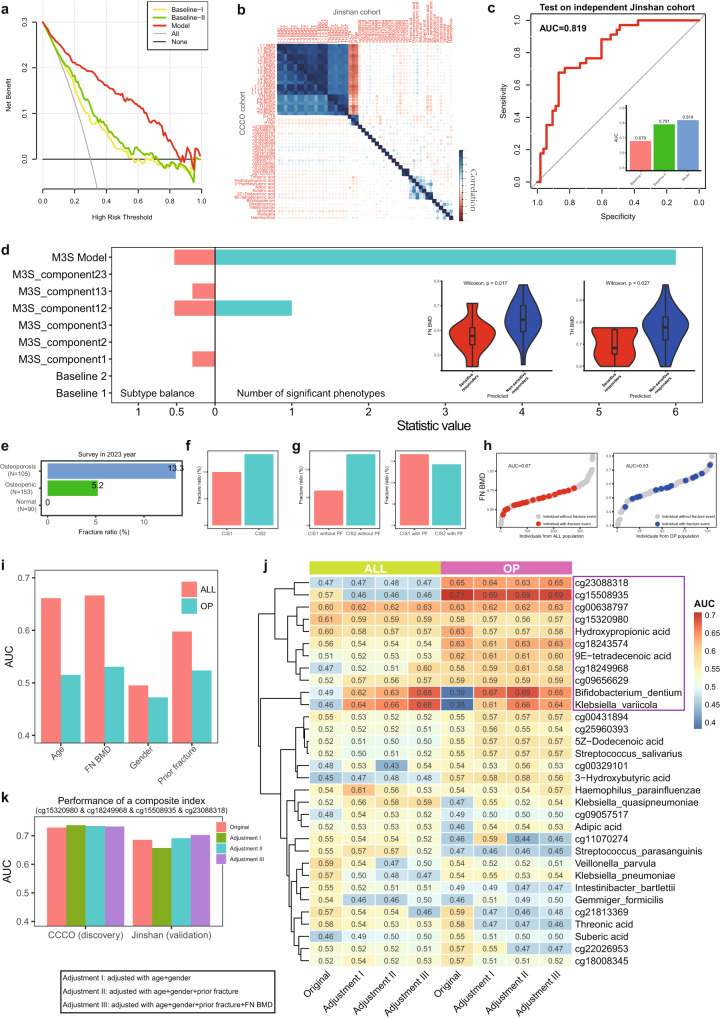
Fig. 7. Clinical application of M3S including risk models for osteoporosis and fracture risk assessment.
a Decision curve of different risk models (osteoporosis vs others), Baseline I: conventional risk factors; Baseline II: Baseline I + BTMs; Model: Baseline II + our multi-modal molecular signatures (M3S). b Independent evaluation of phenotype associations between the CCCO and Jinshan cohorts. c Independent performance evaluation of risk model (osteoporosis vs others) based on M3S, compared to two baseline methods. d Independent performance evaluation of risk model (Yang vs Yin subtypes) based on M3S, compared to other component models and baseline methods. e Statistic of fracture outcome of the CCCO cohort at 4-year of follow-up. f The fracture rate of different osteoporosis subtypes. g The fracture rate of different osteoporosis subtypes adjusted by prior fracture (PF). h Cases of fracture risk assessment by ranking measured with AUC, e.g., the AUC of FN BMD was evaluated in the ALL population (including normal, osteopenic and osteoporosis individuals) and OP population (including individuals with osteoporosis only) respectively. i The AUC of traditional clinical indices of fracture risk. j The original and adjusted AUC of each M3S feature in the ALL and OP populations respectively. k The evaluation of a composite index for fracture risk assessment according to original and adjusted AUC for the discovery cohort (CCCO) and for the independent validation cohort (Jinshan) respectively.

