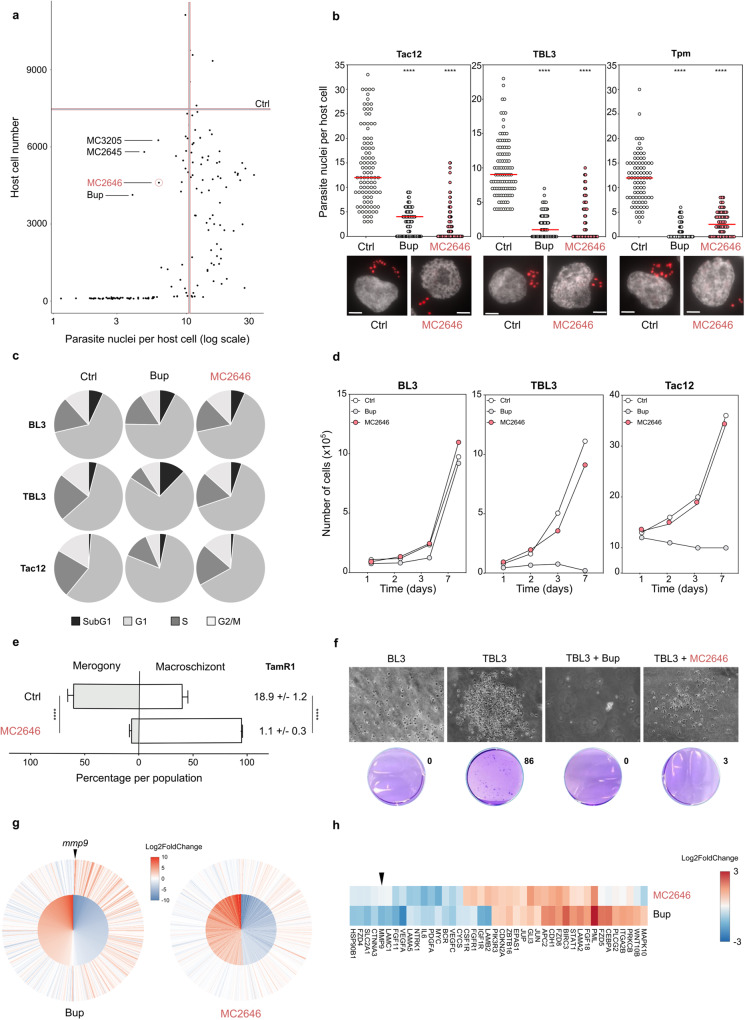
Fig. 1. A compound screen identifies MC2646 which uncouples parasite survival from host survival.
a Screening of a library of 150 compounds (10 µM for 48 h) monitoring host cell number and parasite nuclei number. Graphical representation of parasite and host survival per well. The number of parasite nuclei and host cells in DMSO controls are indicated by vertical and horizontal lines, respectively. Treatment with Buparvaquone (Bup) or three others compounds (MC2645, MC2646, MC3205) reduced parasite survival. b Treatment of Theileria-infected cell lines (Tac12 infected macrophages, TBL3 infected B lymphocytes, and Tpm T. parva infected lymphocytes) with MC2646 or Buparvaquone (Bup) for 48 h, compared to untreated controls (Ctrl). Quantification and representative images showing parasite nuclei marked with parasite-specific histone H3K18me1 and DAPI. At least 50 host cells were counted per condition. One way-Anova, Dunnett’s multiple comparison test, ****p < 0.0001. Leica microscope x100 magnification; the scale bar corresponds to 5 µm. c Flow cytometry analysis of the cell cycle in uninfected B lymphocytes (BL3), infected lymphocytes (TBL3) or macrophages (Tac12) treated with Buparvaquone (Bup) or MC2646, compared to untreated controls (Ctrl). The percentage of G1, S phase, G2/M and sub-G1 populations are shown for each condition. Representative, flow cytometry data are shown in Supplementary Fig. 1b. d Growth curves of infected (TBL3 or Tac12) cells or uninfected (BL3) cells treated with Buparvaquone (Bup) or MC2646. Host cell viability was measured each day and compared to untreated controls (Ctrl). e MC2646 blocks parasite differentiation to merogony. Tac12 infected macrophages were incubated at 41 °C for 10 days (Ctrl) or treated with MC2646. Merogony was monitored visually and by the merogony marker gene TamR1 q-PCR analysis. Two-way Anova, Sidak’s multiple comparisons test, ****p < 0.0001. f MC2646 blocks the transformed phenotype. Colony growth in soft-agar assay was monitored for infected (TBL3) or uninfected (BL3) cells with or without (Ctrl) addition of MC2646 or Buparvaquone. g MC2646 treatment has a modest effect on the parasite-induced bovine transcriptome. Differential expression analysis of the RNA-Seq datasets; the inner circle shows the top 500 bovine genes most significantly (p-val adjusted) impacted by infection (TBL3 vs BL3) and the outer circle shows the effect of drug treatment for each gene. All genes are ordered by descending Log2 fold change (TBL3 vs BL3) for the 1st dataset. The color scale represents Log2Fc, as shown in the legend. The graph was plotted using ggplot2 (v3.3.6) in R v4.1.1. Differential statistical analysis with Weighted Kolmogorov-Smirnov Test. h Differential impact of MC2646 or Buparvaquone on expression of genes in the KEGG Pathways in Cancer geneset. Color scale represents Log2Fc. Genes not detected across datasets, as well as genes with sum absolute Log2Fc < 1.5 were omitted. The genes were then clustered with the Ward.D method, and plotted using pheatmap (v1.0.12). In all experiments (apart from Fig. 1a) cells were incubated with 50 ng/ml Buparvaquone or 1 µM MC2646. All results are representative of 3 independent experiments. Statistical analysis Dunnett’s multiple comparison test. ****p < 0.0001.

