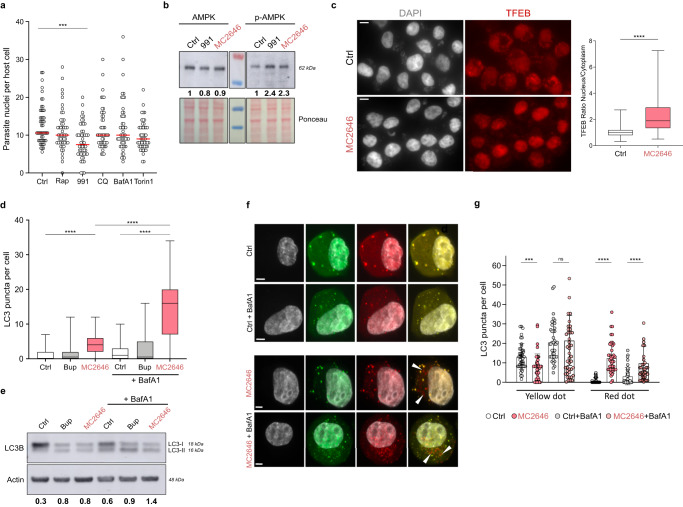
Fig. 3. The compound MC2646 induces autophagy flux leading to parasite loss.
a Testing regulators of autophagy: infected TBL3 cells were incubated with Rapamycin (2 µM), 991 (4 µM), CQ (1 µM), BafA1 (1 µM), or Torin1 (1 µM) for 24 h. Parasite survival was monitored by counting nuclei in DAPI-stained images. At least 50 host cells were counted. Statistical 2-way Anova Dunn’s multiple comparison test. ***p = 0.0009. b Treatment of infected TBL3 cells with MC2646 or 991 compounds resulted in activation of the AMPK pathway (phosphorylation of Thr172, p-AMPK) detected by Western blot analysis. The relative quantification levels are indicated. c Infected TBL3 cells were treated with MC2646 and nuclear translocation of the transcription factor TFEB was monitored by immunofluorescence. The Nuclear:Cytoplasmic ratio was quantified for n = 50 cells. Statistical significance Mann-Whitney test two-tailed ****p < 0.0001. Leica microscope x63 magnification; the scale bar corresponds to 15 µm. d MC2646 induces LC3B puncta and autophagosomes formation. Infected TBL3 cells were incubated with Buparvaquone or MC2646 (24 h) and LC3B puncta were monitored by immunofluorescence. BafilomycinA1 (BafA1) was added (50 nM for 3 h) to block the autophagic flux. Statistical significance One way-Anova, Dunnett’s multiple comparison test, ****p < 0.0001. e The MC2646 compound induces autophagic flux. LC3B isoforms were monitored (same conditions as Fig. 3d) by Western blot analysis. Quantification corresponds to the LC3-II:LC3-I ratio standardized to the Actin control. f The MC2646 compound induces autophagic flux and fusion of autophagosomes and lysosomes. Immunofluorescence analysis of U2OS cells stably expressing a LC3-RFP-GFP reporter treated or not with MC2646 for 24 h. BafilomycinA1 was added (50 nM for 3 h). The red dots, indicating autophagosome induction by the MC2646 compound, are highlighted with white arrows. This is a representative experiment of the 3 that are shown quantitatively in Fig. 3g. Leica microscope x100 magnification; the scale bar corresponds to 5 µm. g Human uninfected U2OS cells expressing the LC3-RFP-GFP reporter plasmid treated with MC2646 and/or BafA1. Yellow puncta indicated the absence of autophagic flux, and red puncta fusion between autophagosomes and lysosomes. Statistical significance 2-way Anova Tukey’s multiple comparison test. At least 50 host cells were counted per condition. Error bar corresponds to the mean with SD. ***p < 0.0002; ****p < 0.0001. In all experiments, cells were incubated with 50 ng/ml Buparvaquone or 4 µM MC2646 for 24 h and/or BafA1 (50 nM for 3 h). Results are representative of 3 independent experiments. The boxplots in graphs indicate the 25% (bottom), 50% (center) and 75% quartiles (top). Whiskers represent the minimum (bottom) and the maximum (top).

