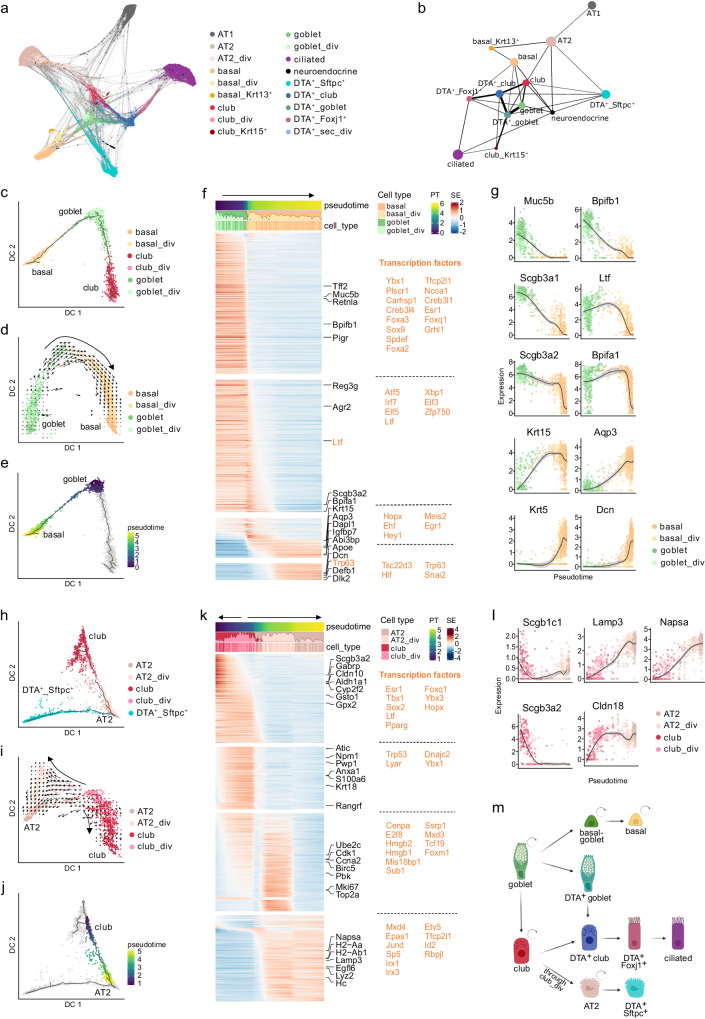
Fig. 7. Differentiation trajectories between epithelial lung cells in SfSRC mice.
a Force-directed graph of single cells with edges to the 10 nearest neighbors. b PAGA graph summarizing the connectivities between cell types. The thickness of the lines represents connectivity between cell types. c Diffusion map of basal, goblet and club cells with pseudotime trajectory colored by cell type. d Diffusion map of basal and goblet cells with RNA velocity vectors indicating differentiation of goblet into basal cells. e Diffusion map of basal and goblet cells with pseudotime of cells selected to characterize the goblet to basal cell trajectory in f. f Smoothed expression heatmap of the top 1000 altered genes along the differentiation trajectory from goblet to basal cells. The names of the top five genes in each cluster are annotated and transcription factors are indicated in orange. All transcription factors of each cluster are listed on the right. g Normalized expression along the goblet to basal cell pseudotime trajectory for exemplary genes. The black line is the smoothed expression using local polynomial regression fitting, with the 95% confidence interval shown in gray. h Diffusion map of club, AT2, and DTA+_Sftpc+ cells with pseudotime trajectory colored by cell type. i Diffusion map of club and AT2 cells with RNA velocity vectors indicating that dividing club cells give rise to club cells and AT2 cells. j Diffusion map of club, AT2, and DTA+_Sftpc+ cells with pseudotime trajectory colored by pseudotime of the cells selected to characterize the club to AT2 cell trajectory in k. k Smoothed expression heatmap of the top 1000 altered genes along the differentiation trajectory from club to AT2 cells. l Normalized expression along the club to AT2 cell pseudotime trajectory for exemplary genes. Smoothed expression and confidence interval are shown as in g. Figures were calculated on merged data from all timepoints (day 0, 2, and 3). m Proposed model of differentiation routes (straight arrows) and self-renewal capacities (curved arrows) of lung epithelial cells based on data and mouse models in this study. Created with BioRender.com. PT pseudotime, SE scaled expression.

