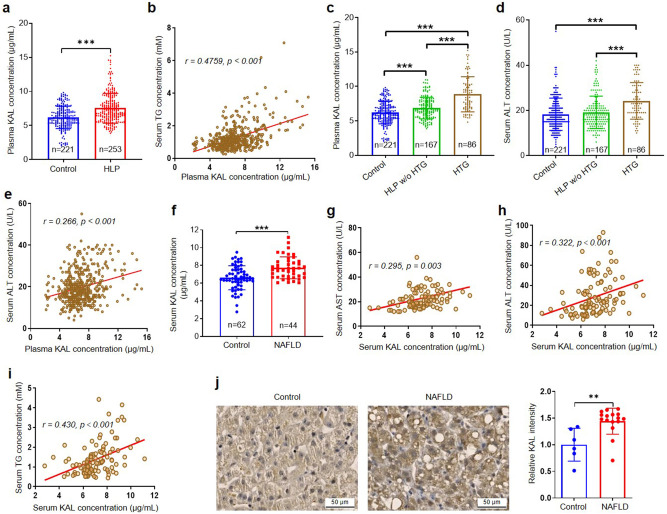
Fig. 1.
The content of KAL is increased in HLP and NAFLD patients, and positively correlated with TG. a The plasma KAL concentration in HLP subjects. b Correlation analysis of plasma KAL levels and TG concentrations. c The plasma KAL concentration in control and HLP subjects. d The serum ALT concentration in control and HLP subjects. e Correlation analysis of plasma KAL levels and ALT concentrations in control and HLP subjects. (a–e: Control, n = 221; HLP, n = 253; HLP w/o HTG, HLP without HTG, n = 167; HTG, n = 86). f The serum KAL concentration in NAFLD patients. g–i Correlation analysis of serum KAL levels with AST, ALT and TG. (f–i: Control, n = 62; NAFLD, n = 44). j Representative images and quantification of KAL level in the livers from NAFLD patients (Control, n = 6; NAFLD, n = 16). Scale bar: 50 μm. Data are expressed as mean ± SD. **p < 0.01, ***p < 0.001

