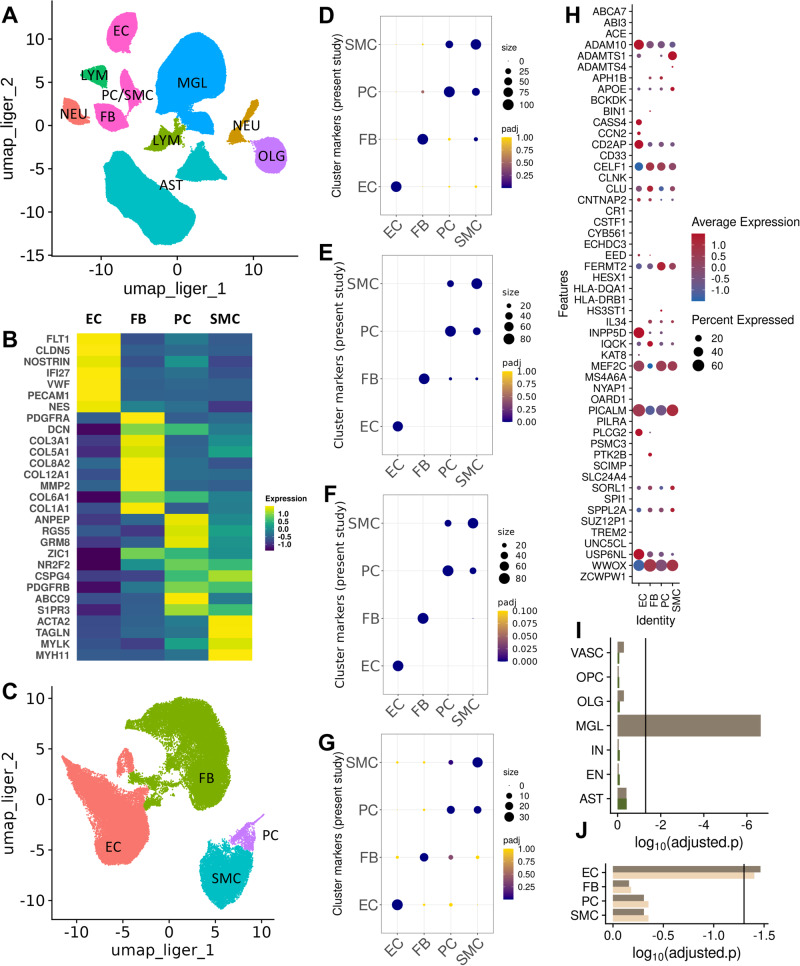
Fig. 1. Characterisation of cell-type specific transcriptomes and their relative enrichment in Alzheimer’s disease risk genes.
A UMAP plot of the integrated snRNAseq dataset from 57 brain samples. B UMAP plot after re-integration and clustering of the EC, FB, PC and SMC nuclei in (A) for discrimination between PC (cyan) and SMC (purple) nuclei (EC, coral and FB, green). C Heatmap of the average scaled expression of representative marker genes for each cluster. D−F Dot plots of the overlap between cell markers for EC, FB, PC and SMC previously identified in human17,19,26 and (G) mouse25 snRNAseq studies and the cluster markers used in the present study. The size of the dots correspond to the overlap between the cluster gene sets and the colour of the dot to the adjusted p value of a one-sided overrepresentation Fisher’s exact test. H Dot plot of the average scaled per cluster expression of genes previously associated with genetic risk for AD (size, percentage of nuclei per cluster with >1 count; colour scale, average scaled gene expression). I MAGMA.Celltyping enrichment of brain nuclei in genomic loci associated with genetic risk for AD. The bars correspond to the log10p-value (one-sided) of the enrichment in GWAS signal i.e., the linear regression between cell type specificity of gene expression and the common variant genetic association with the disease using information from all genes (dark brown, line indicates significance threshold adjusted for all cell types). Enrichment of vascular nuclei is reduced after controlling for genes enriched in microglia (dark green). This analysis was performed on 153’128 nuclei from 36 independent samples (J) MAGMA.Celltyping AD risk gene enrichment of nuclei of the brain vasculature (dark brown bar, line indicates significance threshold adjusted for vascular cell types). Enrichment is not changed substantially after controlling for the enrichment of genetic loci associated with white matter hyperintensities (WMH) (light brown). This analysis was performed on 51’874 nuclei from 57 independent samples Abbreviations: AST astrocytes, EC endothelial cells, FB fibroblasts, MGL microglia, NEU neurons, NEU neurons, OLG oligodendrocytes, PC/SMC pericytes and smooth muscle cells, LYM lymphocytes. Source data are provided as a Source data file.

