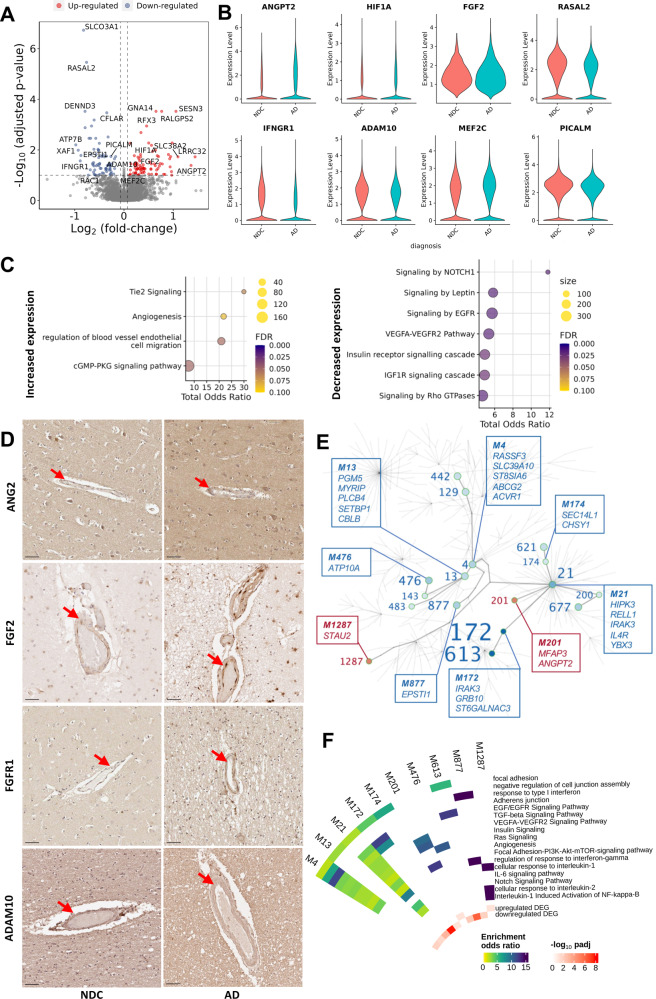
Fig. 2. Alzheimer’s disease is associated with dysregulation of vascular homoeostasis in EC.
A Volcano plot showing genes differentially expressed in AD relative to NDC donor cortical tissue in EC. Representative significantly differentially expressed genes are identified. B Violin plots of representative genes differentially expressed in EC with AD relative to NDC. ANGPT2 (logFC=1.46, padj=0.04), HIF1A (logFC=0.68, padj=0.02), MEF2C (logFC=0.28, padj=0.09) and FGF2 (logFC=0.34, padj=0.05) are significantly upregulated, whereas RASAL2 (logFC = −0.76, padj=3.48×10⁻⁶), IFNGR1 (logFC=0.89, padj=0.03), ADAM10 (logFC = −0.30, padj=0.06) and PICALM (logFC = −0.27, padj=0.02) are downregulated. Statistical significance was determined using a likelihood ratio test with a mixed-effects model and a zero-inflated negative binomial distribution (two-sided). For demonstration purposes, the FGF2 violin plot describes expression only for nuclei in which FGF2 is expressed, although the statistical analysis was performed on all nuclei. C Dot plots of the functional enrichment analysis on the DEG that are up- and down-regulated in EC (dot size, functional enrichment gene set size; colour, FDR, one-sided overrepresentation Fisher’s exact test) with AD relative NDC. D IHC of sections from the somatosensory cortex of NDC (left) and AD (right) donors highlighting increased expression of ANG2 (coded by ANGPT2), FGF2, FGFR1 and decreased expression of ADAM10 in the vessel wall with AD. Arrowheads denote the protein binding in the vascular wall. Scale bar = 50 μm. The IHC experiment was performed on 24 independent samples. E Gene co-expression module hierarchy for EC. Modules that belong to the same branch are related, i.e., larger (“parent”) modules are closer to the centre of the plot and are further divided into subset (“children”) modules. “Children” modules are subsets of the “parent” ones and have higher numbers as names than their “parents”. Modules that show a significant overrepresentation of DEG (as shown in the volcano plots of Fig. 2A) by means of a (one-sided) Fisher’s exact test are labelled and represented as coloured points in the graph (red, for modules showing an overrepresentation of upregulated DEG; blue, showing an overrepresentation of downregulated DEG). Module number font size corresponds to the significance of the overrepresentation of DEG in the module. In the boxes, the top (maximum 5) hub genes (genes with the higher number of significant correlations within the module) are described. F Circular heatmap of odds ratios from the functional enrichment analyses for the EC modules that show a significant DEG overrepresentation (significant modules that show redundant functional enrichment terms were omitted from this heatmap). The adjusted p values of the significance of the overrepresentation are provided in Supplementerary file 5. The inner two tracks of the circular heatmap represent the significance (−log10(padj), one-sided) of the overrepresentation of down- (innermost track) and up-regulated DEG (second innermost track). The DGE and co-expression analyses were performed on 70’537 nuclei from 77 independent samples. Source data are provided as a Source data file.

