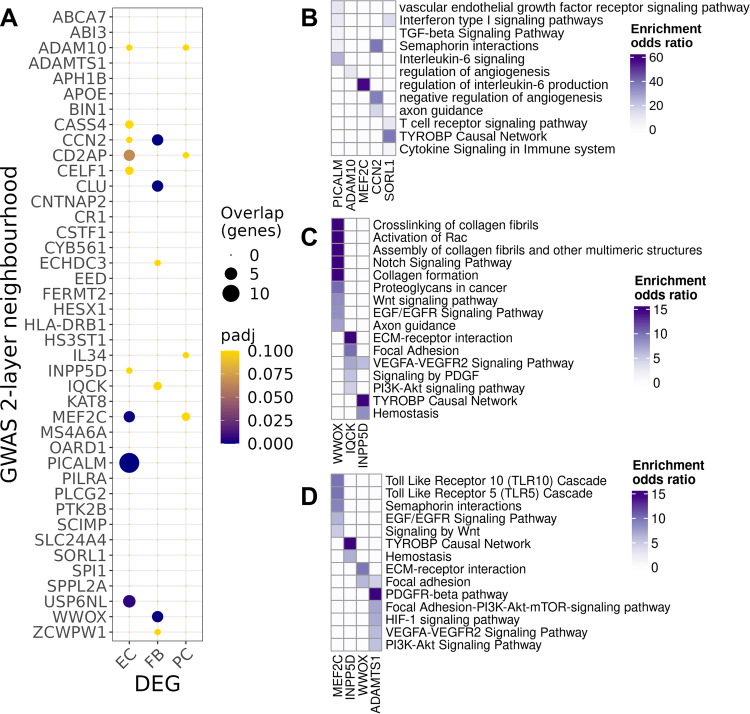
Fig. 4. Differentially expressed genes (DEG) with AD relative to NDC found in two-layer neighbourhoods of AD risk genes.
A Dot plot of the overrepresentation of DEG identified in each cluster (abscissa) in the 2-layer neighbourhood of each GWAS gene (ordinate) (dot size, number of the overlapping genes; colour, adjusted p value of the one-sided Fisher’s exact test). Functional enrichment of prioritised GWAS genes in EC (B), FB (C) and PC (D)(colour scales represent the odds ratios of enrichment). Adjusted p values of the (one-sided) Fisher’s exact test are provided in the source data and in Supplementary file 7. Source data are provided as a Source data file.

