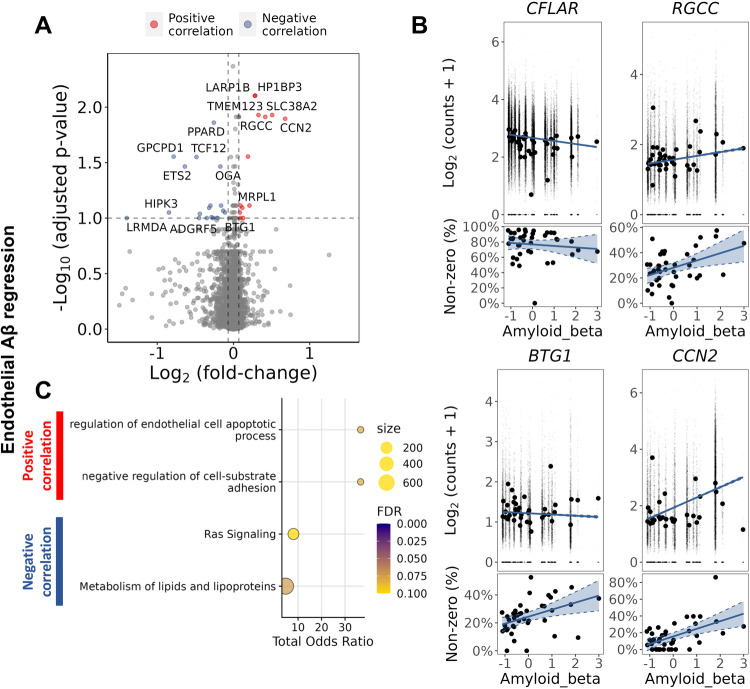
Fig. 5. Increased gene expression in EC with increased Aβ immunohistochemical staining density highlighted increased expression of genes associated with apoptosis.
A Volcano plot showing genes with a significant positive (red) of negative (blue) correlation with tissue Aβ staining density in EC. B Regression plots of individual genes associated with apoptosis, illustrating their association with Aβ levels: CFLAR (logFC = −0.32, padj=0.08), RGCC (logFC=0.42, padj=0.01), BTG1 (logFC=0.1, padj=0.09) and AKR1C3 (logFC=0.19, padj=0.03). For each gene, two plots are presented, the plot in the upper row show the scatter plot of the regression between the average expression value and the Aβ density in each sample, whereas the plot in the lower row shows the regression between the percentage of non-zero count nuclei in each sample and the Aβ density in each sample. The DGE analysis was performed using a likelihood ratio test with a mixed-effects model and a zero-inflated negative binomial distribution (two-sided). It takes into account both the distribution of the non-zero normalised counts (corresponding to the plot in the upper row) and the abundance of non-zero nuclei in the samples (corresponding to the lower row). Aβ in the horizontal axis is presented as scaled IHC binding values. The best-fit linear regression lines and 95% confidence intervals are shown. C Dot plots of the functional enrichment analysis on the DEG that are positively and negatively associated to Aβ (dot size, functional enrichment gene set size; colour, FDR, one-sided overrepresentation Fisher’s exact test). Source data are provided as a Source data file.

