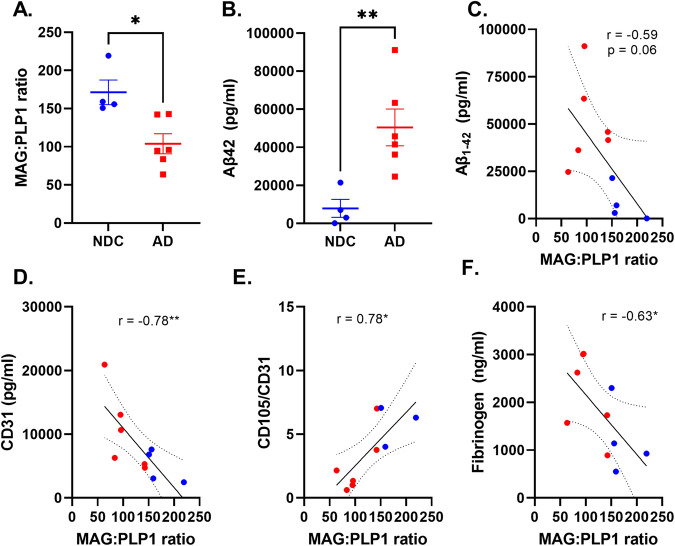
Fig. 7. Defective angiogenesis and blood brain barrier leakage is associated with cerebral hypoperfusion and Aβ pathology in AD.
A Scatterplot showing reduced MAG:PLP1 ratio (logFC = −0.72, unadjusted p = 0.012, two-sided t test) in the temporal cortex with AD (red dots) relative to NDC (blue dots). Horizontal bars represent the mean ± SEM. This experiment was performed on 10 independent samples (4 NDC and 6 AD). B Scatterplot showing increased insoluble Aβ42 in the temporal cortex with AD relative to NDC (logFC=2.67, unadjusted p = 0.009). This experiment was performed on 10 independent samples (4 NDC and 6 AD). Scatterplots showing the relationship between MAG:PLP1 and Aβ (Pearson’s r = −0.59, unadjusted p = 0.067, 10 samples, 4 NDC and 6 AD) (C), CD31 (endothelial marker) (Pearson’s r = −0.78, unadjusted p = 0.008, 10 samples, 4 NDC and 6 AD) (D), the ratio of CD105 (a marker of neoangiogenesis) adjusted to CD31 content (Pearson’s r = 0.78, unadjusted p = 0.011, 9 samples, 3 NDC and 6 AD) (E) and tissue fibrinogen concentration (Pearson’s r = −0.63, unadjusted p = 0.0049, 10 samples, 4 NDC and 6 AD) (F). The best-fit linear regression lines and 95% confidence intervals are shown. Each point represents the mean of duplicate measurements for an individual. *p < 0.05, **p < 0.01. Source data are provided as a Source data file.

