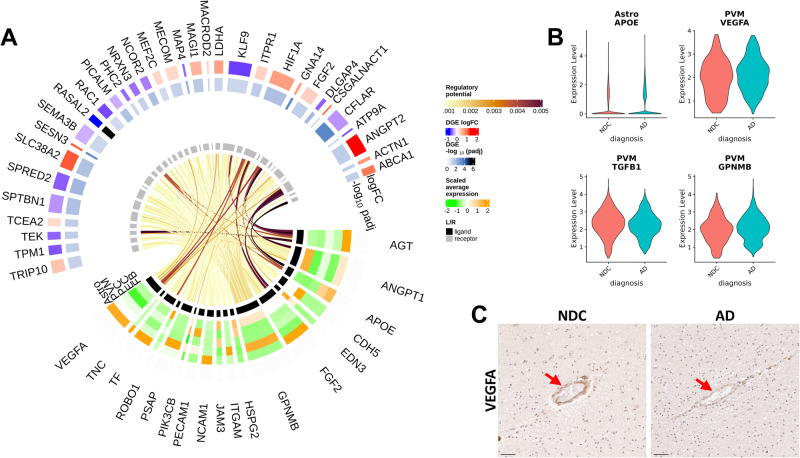
Fig. 8. NicheNet intercellular communication analysis identified potential regulators of EC DEG associated with proinflammatory and anti-angiogenic gene expression in astrocytes and perivascular macrophages.
A Circular heatmap and chord diagram of the results of the NicheNet analysis. The circular plot is divided (based on the innermost track) to separately represented ligand (black track) and target genes (grey track). A heatmap for the ligand genes on the 2nd to the 6th tracks (from inner- to outer-most) represents the average scaled expression of each ligand in each of the “sender” vascular cell types (each cell type -log10(padj) is represented on a different track). The two outermost tracks describe the differential expression (logFC) of the associated genes in the “received” EC. The outermost track represented the logFC and the 2nd outermost track represents the value. The links of the diagram represents the regulatory potential between the ligand and the target genes. B Astrocytic APOE (logFC=0.96, pval = .03), PVM VEGFA (logFC = −0.31, pval=0.08), TGFB1 (logFC = −0.28, pval=0.0007) and GPNMB (logFC=0.23, pval=0.04) potentially regulate the majority of EC DEG and are significantly differentially expressed with AD relative to NDC. Statistical significance was determined using a likelihood ratio test with a mixed-effects model and a zero-inflated negative binomial distribution. The analysis was performed on 170’299 astrocytic and 14’861 PVM nuclei from 57 independent samples. P values (unadjusted) refer to two-sided statistical tests. Source data are provided as a Source data file. C IHC in a sample form the entorhinal cortex of sections from NDC (left) and AD (right) donors binding of VEGFA in the vessel wall with AD. Arrowheads denote the VEGFA binding in the vascular wall. The IHC experiment was performed on 24 independent samples. Scale bar = 50 μm. Source data are provided as a Source data file.

