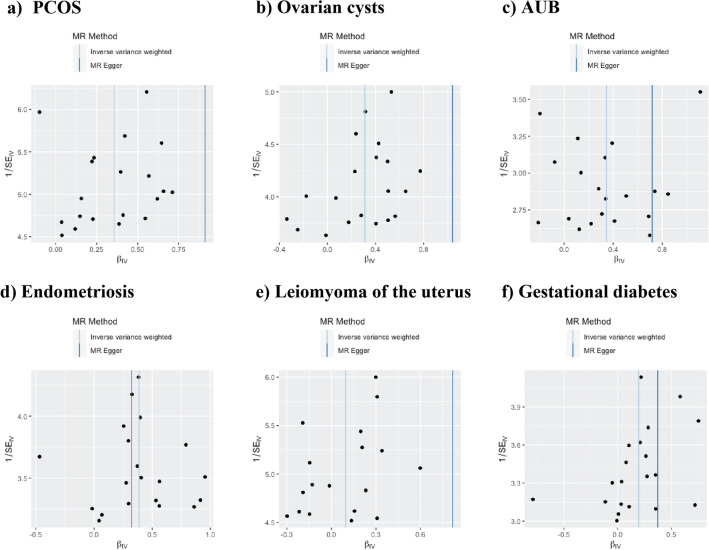
Figure 5.
Funnel plots depicting the impact of genetically predicted depression or dysthymia on the risk of female reproductive disorders. The funnel plots show the Inverse variance weighted and MR-Egger MR estimate of each depression/dysthymia single-nucleotide polymorphism with different female reproductive disorders versus 1/standard error (1/SEIV). (a) PCOS; (b) ovarian cysts; (c) AUB; (d) endometriosis; (e) leiomyoma of the uterus; (f) gestational diabetes.

