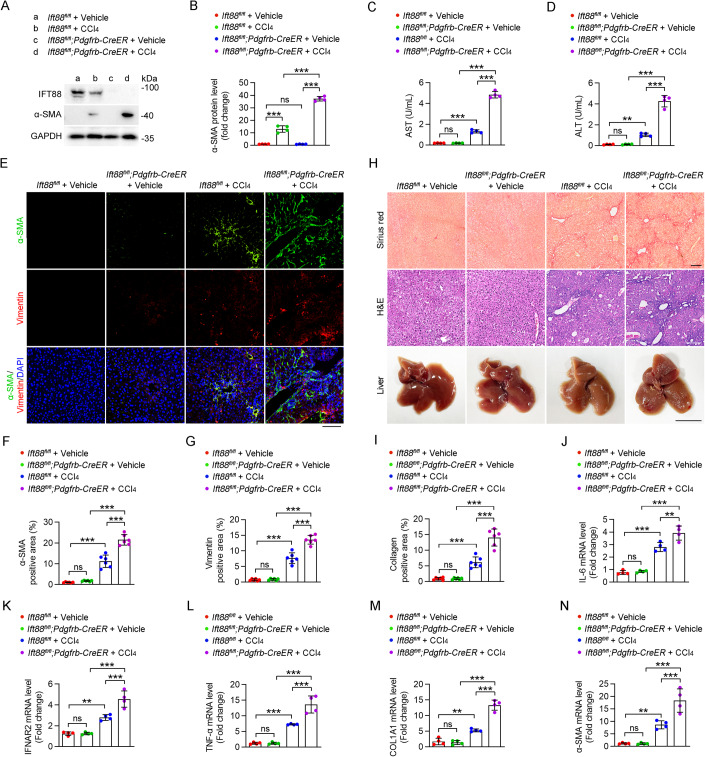
Figure 2. HSC-specific IFT88 deficiency exacerbates CCl4-induced liver fibrosis.
(A, B) Immunoblotting (A) and quantification (B) of the levels of IFT88 and α-SMA in HSCs isolated from CCl4- or corn oil (vehicle)-treated Ift88fl/fl and Ift88fl/fl;Pdgfrb-CreER mice for 1 month (n = 4 mice). (C, D) Examination of AST (C) and ALT (D) activities in the serum of Ift88fl/fl and Ift88fl/f;Pdgfrb-CreER mice treated with CCl4 or vehicle for 1 month (n = 4 mice). (E–G) Immunofluorescence images (E) and quantification of the levels of α-SMA (F) and vimentin (G) in the liver of Ift88fl/fl and Ift88fl/fl;Pdgfrb-CreER mice treated with CCl4 or vehicle for 1 month (n = 6 mice). Nuclei were stained with DAPI (blue). Scale bar, 100 μm. (H, I) CCl4-induced liver fibrosis in Ift88fl/fl and Ift88fl/fl;Pdgfrb-CreER mice was examined with Sirius red staining and H&E staining (H), and the percentage of collagen-positive areas was quantified (I) (n = 6 mice). Scale bars for Sirius red staining and H&E staining, 200 μm. Scale bar for liver, 1 cm. (J–N) The mRNA levels of IL-6 (J), IFNAR2 (K), TNF-α (L), COL1A1 (M), and α-SMA (N) in liver tissues were measured by quantitative RT-PCR (n = 4 mice). Data information: Data are presented as mean ± SD. Statistical significance was determined by two-way ANOVA with post hoc tests. ns not significant; **P < 0.01, ***P < 0.001. See also Figs. EV3 and EV4. Source data are available online for this figure.

