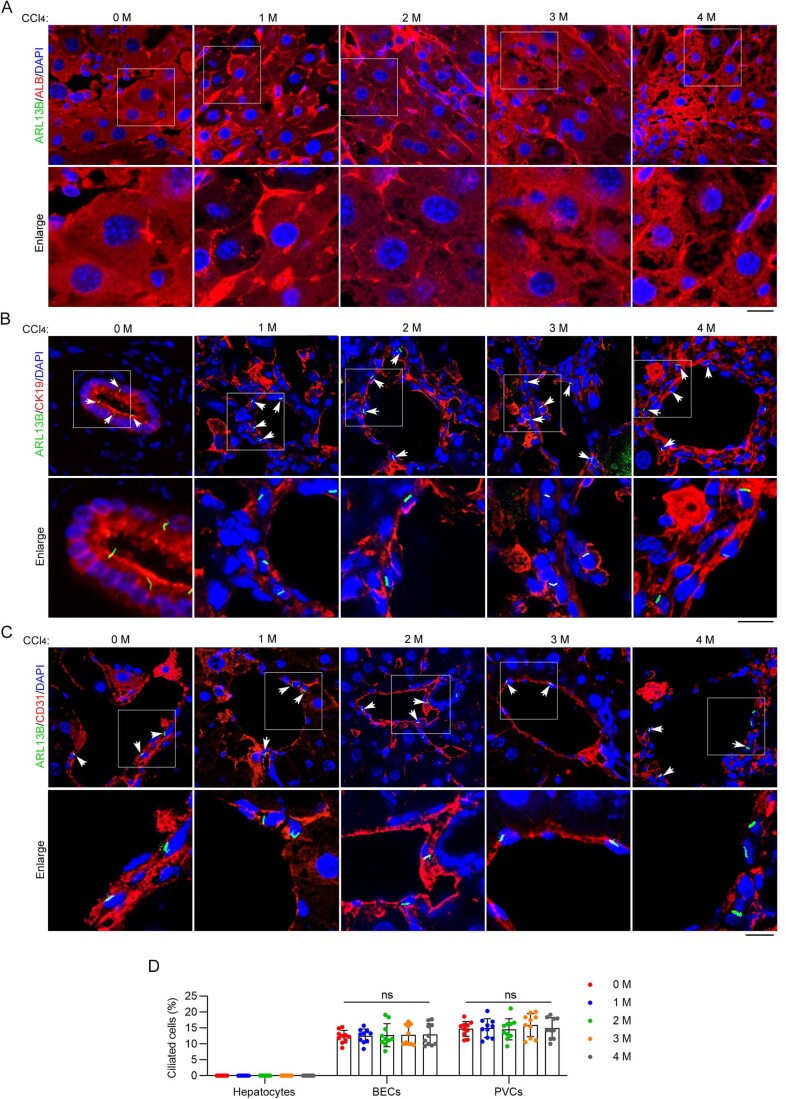
Figure EV2. Persistent presence of primary cilia on BECs and PVCs during CCl4-induced liver fibrosis.
(A–C) Immunofluorescence images of primary cilia on hepatocytes (A), BECs (B), and PVCs (C) from CCl4-treated mice (n = 10 mice). Scale bars, 10 μm. (D) Quantification of the percentage of ciliated cells in hepatocytes, PVCs, and BECs from mice described in (A–C) (n = 10 mice). To quantify the percentage of ciliated cells (D), >200 cells from six fields were analyzed for each mouse. The same group of mice (n = 10 mice for each time point) were used for Fig. 1A–D and Fig. EV2. Data information: Data are presented as mean ± SD. Statistical significance was determined by one-way ANOVA. ns not significant. Related to Fig. 1. Source data are available online for this figure.

