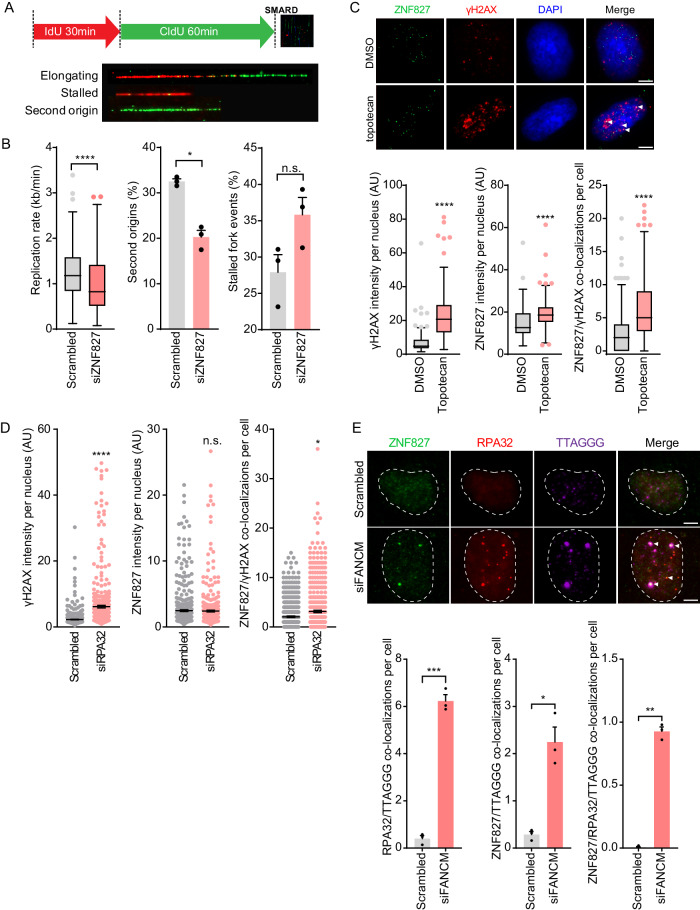
Fig. 2. ZNF827 accumulates at sites of replication-associated DNA damage.
A DNA fibre assay and replication events. B Replication rate in U-2 OS cells following ZNF827 depletion (left panel). Data represent n = 191 fibres in scrambled and n = 197 fibres in siZNF827 cells across three independent experiments plotted as Tukey box plots; *P = 0.0075, ****P < 0.0001, n.s. not significant (P = 0.08) by two-tailed unpaired Mann–Whitney or Welch’s t-test. Percentage second origins (middle panel) and percentage stalled fork events (right panel) in U-2 OS cells following ZNF827 depletion. Data presented as mean + SEM from three independent experiments with at least 200 fibres from each experiment. n.s. non-significant; *P < 0.05 by two-tailed t-test. C Representative images of γH2AX (red) and endogenous ZNF827 (green) foci in U-2 OS cells (top panel). White arrows indicate colocalizations. Scale bar represents 5 μm. Quantitation of γH2AX and ZNF827 integrated intensity per nucleus, and γH2AX and ZNF827 colocalizations per nucleus (bottom panel) from n = 508 nuclei in DMSO and n = 399 nuclei in topotecan-treated cells using CellProfiler. At least 50% overlap criterion was applied for colocalization count. Data are representative of two independent experiments and presented as Tukey box plots; ****P < 0.0001 by two-tailed unpaired Mann–Whitney tests. D Quantitation of γH2AX and ZNF827 integrated intensity per nucleus, and ZNF827 and γH2AX colocalizations per nucleus in U-2 OS cells 72 h post RPA32 knockdown. Out of three experiments, n = 493 nuclei in scrambled and n = 431 nuclei in siRPA32 treated cells were scored. Data presented as mean ± SEM; ****P < 0.0001, *P = 0.01, n.s. not significant (P = 0.23) by two-tailed unpaired Mann–Whitney tests. E Representative images of endogenous ZNF827 (green), RPA32 (red) and telomeric DNA (purple) in U-2 OS cells 72 h post FANCM knockdown (top panel). White arrows indicate colocalizations. Scale bar represents 5 μm. Quantitation of RPA32 and ZNF827 colocalizations with telomeres, and RPA32, ZNF827 and telomere colocalizations from at least 150 nuclei per replicate (bottom panel). At least 50% overlap criterion was applied for colocalization count. Data are representative of three independent experiments and presented as mean + SEM; *P = 0.0251, **P < 0.0011, ***P = 0.0004 by two-tailed unpaired Welch’s t-test. Source data are provided as a Source Data file.

