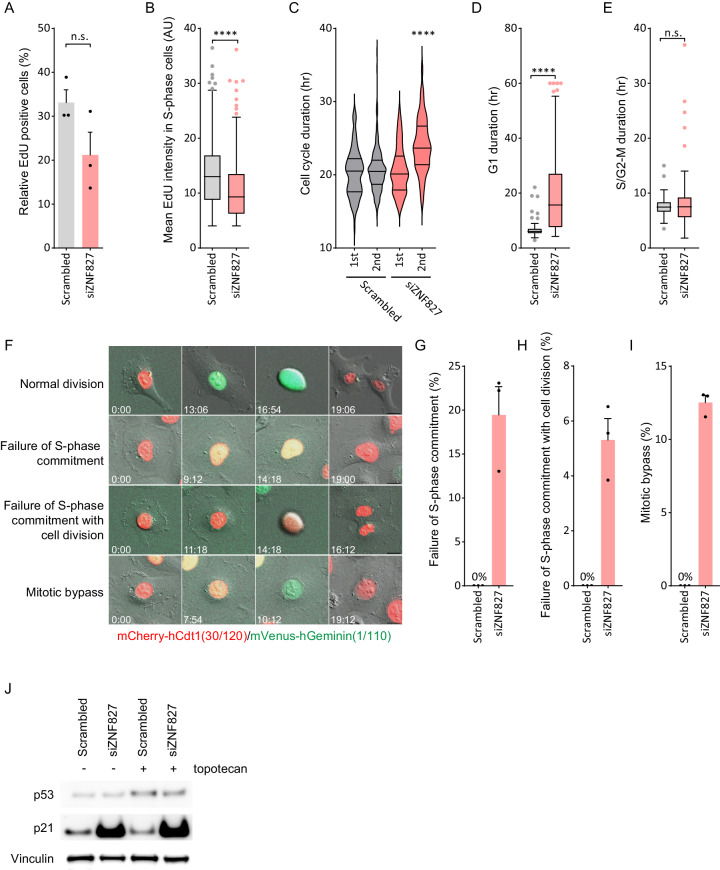
Fig. 5. ZNF827 depletion results in cell cycle dysregulation.
A Quantitation of EdU-positive U-2 OS cells 72 h post ZNF827 depletion. Data presented as mean + SEM from at least 500 cells across three independent experiments. n.s. non-significant (p = 0.1337) by two-tailed unpaired Welch’s t-test. B Quantitation of mean EdU intensity in EdU-positive S-phase cells. Data presented as Tukey box plots from n = 975 cells in scrambled and n = 546 cells in siZNF827 treated U-2 OS cells across three independent experiments. ****P < 0.0001 by two-tailed unpaired Mann–Whitney test. C Cell cycle duration analysis of U-2 OS live cell imaging data from 6 h post ZNF827 siRNA transfection. Cell cycle duration was assayed in n = 98 and n = 88 scrambled and siZNF827 cells, respectively. Data presented as Violin plots; ****P < 0.0001 by Mann–Whitney test. Quantitation of live cell imaging in HT1080 FUCCI cells following ZNF827 depletion showing D G1 duration, E S/G2-M duration. Out of three experiments, n = 74 scrambled and n = 104 siZNF827 cells were assayed for G1 duration; n = 74 scrambled and n = 59 siZNF827 cells were assayed for S/G2-M duration. Data presented as Tukey box plots, ****P < 0.0001, n.s. = non-significant (P = 0.91) by two-tailed unpaired Mann–Whitney test. F Representative images from live cell imaging of HT1080 FUCCI cells showing cell division in G1. Time is shown as hours: minutes relative to the first image of the series. Quantitation of live cell imaging in HT1080 FUCCI cells following ZNF827 depletion showing G proportion of cells that transition from G1 to S to G1 (failure of S phase commitment), H proportion of cells that divide in G1 (failure of S phase commitment with cell division), and I proportion of cells that undergo mitotic bypass. Data presented as mean + SEM from 40 cells per replicate from three biological replicates. n.s. non-significant, ****P < 0.0001 by two-tailed t-test. J Western blot analysis of p21 and p53 in U-2 OS cells following 72 h ZNF827 depletion, including topotecan treatment (n = 3). Vinculin used as a loading control. Source data are provided as a Source Data file.

