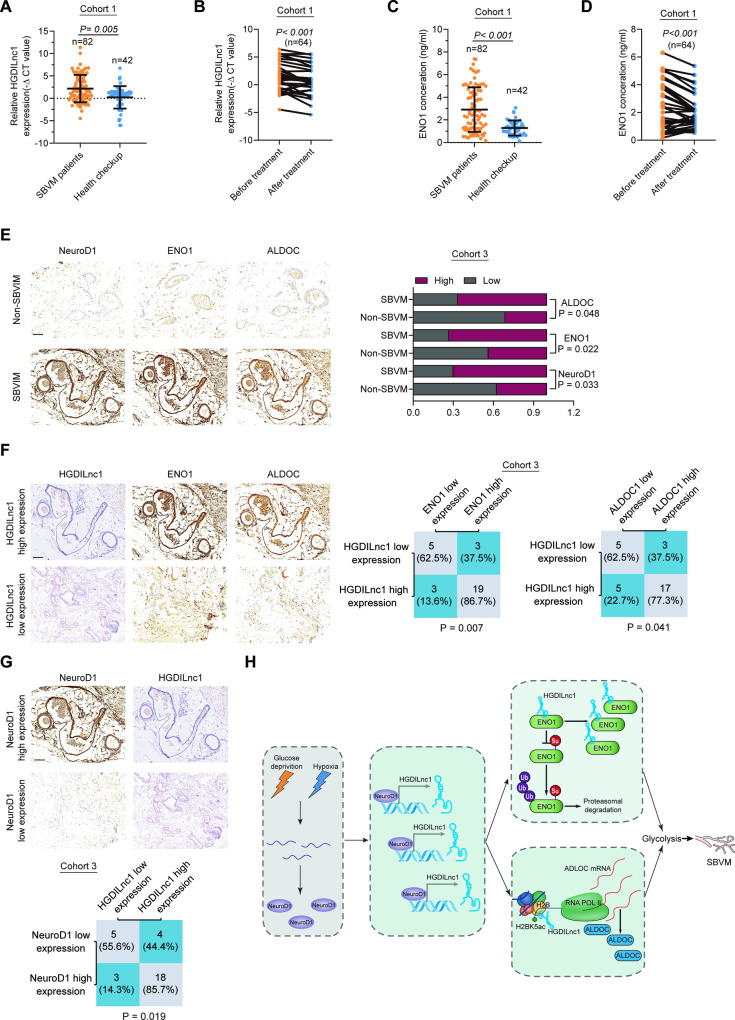
Fig. 7. Clinical significance of the NeuroD1/HGDILnc1/ENO1/ALDOC axis in SBVM patients.
A HGDILnc1 expression in the sera of healthy individuals (n = 42) and SBVM patients (n = 82) in cohort 1. B HGDILnc1 expression in the sera of SBVM patients before and after thalidomide treatment (n = 32) in cohort 1. C ENO1 expression in the sera of healthy individuals (n = 42) and SBVM patients (n = 82) in cohort 1. D ENO1 expression in the sera of SBVM patients before and after thalidomide treatment (n = 32) in cohort 1. E Representative immunohistochemical images (left) of NeuroD1, ENO1, and ALDOC in SBVM tissues and non-SBVM tissues using IHC analysis and statistical analysis of the proportions of high and low staining in SBVM tissues and non-SBVM tissues (right). Scale bars: 100 μm. F Representative in situ hybridization images of HGDILnc1 and immunohistochemical images of ENO1 and ALDOC expression in SBVM with high expression and low HGDILnc1 expression (left), and statistical analysis of SBVM tissues under different staining conditions (right) in cohort 3. Scale bars: 100 μm. G Representative immunohistochemical images of NeuroD1 expression and in situ hybridization images of HGDILnc1 expression in SBVM with high and low NeuroD1 expression (up), and statistical analysis of SBVM tissues under different staining conditions (down) in cohort 3. Scale bars: 100 μm. H Schematic diagram of the relationship among glucose deprivation, hypoxia, NeuroD1, HGDILnc1, ENO1, ALDOC, glycolysis metabolism, and SBVM. Note: the representative immunohistochemical images of ENO1, ALDOC in SBVM tissue in (E) were same to the representative immunohistochemical images of ENO1, ALDOC in SBVM with high expression of HGDILnc1 in (F) for illustration of different proteins expression in the same SBVM patients.

