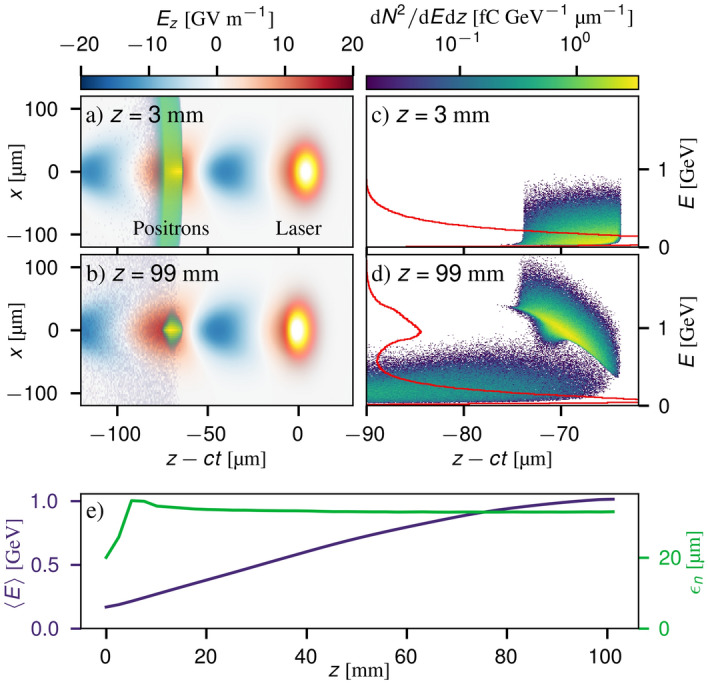
Figure 7.

Simulated post-acceleration of a laser-generated positron beam. (a, b) show the longitudinal electric fields of the plasma wakefield generated by the laser pulse (yellow orb) and the trailing positron bunch (density in a logarithmic colour-scale) at the beginning of the plasma and after 96 mm of propagation. Panels (c, d) show the positron longitudinal phase space before and after acceleration, with the energy spectra indicated by the red lines. (e) shows the average energy and normalised emittance of the trapped bunch, defined as being comprised of particles which remain within µm of the central axis.
