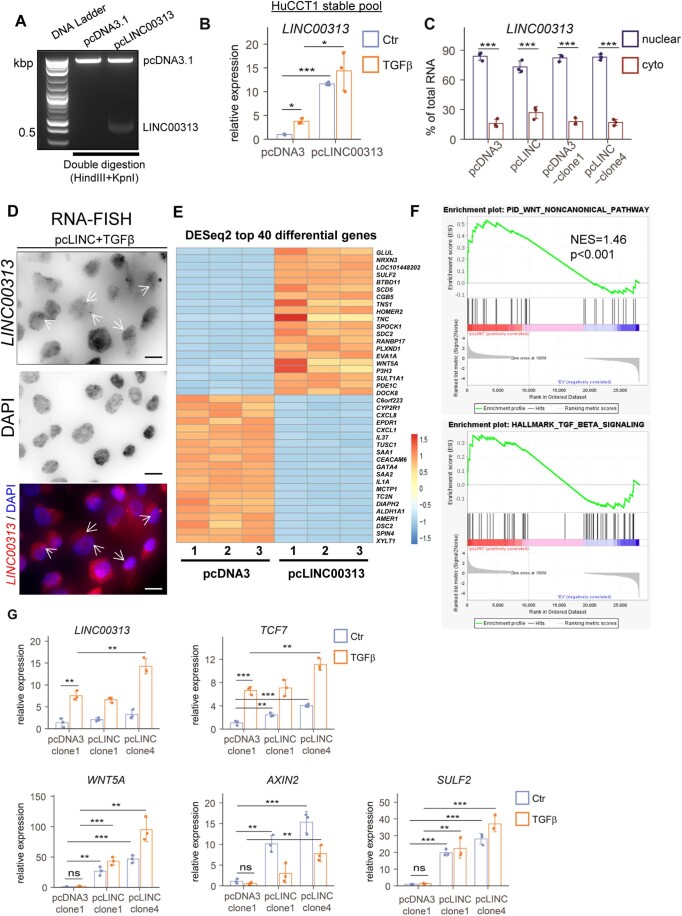
Figure EV3. LINC00313 gain of function up-regulates Wnt-related genes.
(A) Efficient ligation of LINC00313 insert to pcDNA3.1 plasmid vector was verified by double digestion with restriction enzymes, followed by agarose gel electrophoresis. Molecular size (in kbp) marker ladder is shown in the first lane. (B) Real-time qPCR analysis of LINC00313 expression in HuCCT1 cells stably over-expressing pcDNA3.1 or pcLINC00313 expression vectors stimulated or not with TGFβ1 for 16 h. (C) Subcellular fractionation followed by RT-qPCR analysis of LINC00313 RNA levels in nuclear and cytoplasmic fractions of HuCCT1 cells transiently over-expressing an empty vector (pcDNA3.1) or LINC00313 and HuCCT1 clones, stably over-expressing pcDNA3.1 or LINC00313. (D) smiFISH for LINC00313 RNA in HuCCT1 cells stably over-expressing LINC00313 and stimulated with TGFβ for 16 h. DAPI was used to stain nuclei. Scale bars: 15 μm. (E) Heatmap presenting the top 40 differentially regulated genes in HuCCT1 pcLINC00313 versus pcDNA3-expressing cells (shrunken log2FC > 1, adjusted p-value < 0.1). Biological triplicates (1-3) were used per condition. (F) GSEA analysis of differentially expressed genes in pcLINC00313 versus pcDNA3 HuCCT1 cells. (G) Real-time qPCR analysis of LINC00313, TCF7, WNT5A, AXIN2, and SULF2 expression in a monoclonal HuCCT1 cell line stably expressing pcDNA3.1 and in two monoclonal HuCCT1 cell lines stably expressing pcLINC00313, in the presence or not of TGFβ1 for 16 h. Data information: Data in panels (B), (C) and (G) are presented as mean ± SD (n = 3 biological replicates). *P ≤ 0.05, **P ≤ 0.01, ***P ≤ 0.001 (Student’s t-test). In panel (F) the Kolmogorov-Smirnov test was used for statistical analysis of GSEA. Source data are available online for this figure.

