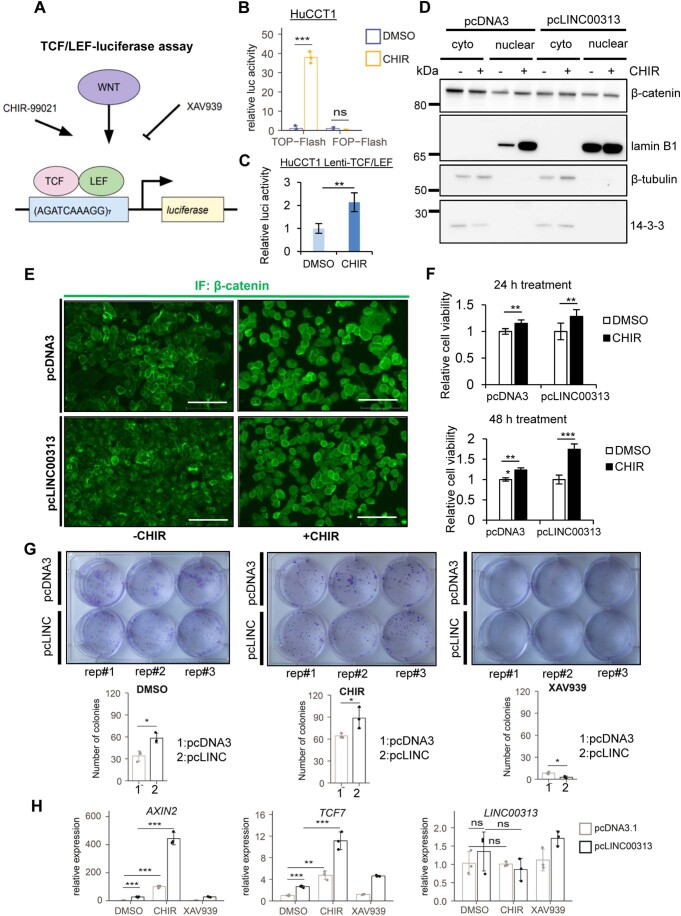
Figure EV4. LINC00313 modulates chemically-induced Wnt/β-catenin signalling and impacts physiological processes in CCA.
(A) Schematic representation of the TCF/LEF-luciferase reporter assay. Activators (Wnt ligands, CHIR) and inhibitors (XAV939) of TCF/LEF-dependent responses are also shown. (B) TCF/LEF-luciferase reporter assay in HuCCT1 cells transiently transfected with TOP-Flash or FOP-Flash luciferase expression vectors and treated with CHIR99021 or DMSO for 24 h. Cells were co-transfected with a Renilla luciferase expression vector for normalization of the firefly luciferase activity. (C) TCF/LEF-luciferase reporter assay in HuCCT1 cells stably expressing the pGreenFire 2.0 TCF/LEF reporter construct and treated with CHIR99021 or DMSO for 24 h. TCF/LEF-luciferase reporter assay in HuCCT1 cells stably expressing the pGreenFire 2.0 TCF/LEF reporter construct and treated with the indicated concentrations of TGFβ1 or BSA/HCl (Ctr) for 16 h. (D) Subcellular fractionation followed by immunoblotting for β-catenin, lamin B1 (nuclear marker), β-tubulin and 14-3-3 (cytoplasmic markers) using nuclear and cytoplasmic fractions of HuCCT1 cells stably over-expressing an empty vector (pcDNA3.1) or LINC00313 and treated with CHIR99021 or DMSO for 24 h. (E) Immunofluorescence to detect β-catenin subcellular localization in control or LINC00313 over-expressing HuCCT1 cells, treated or not with CHIR99021 or DMSO for 24 h. Scale bars: 150 μm. (F) Cell viability assays in control or LINC00313 over-expressing HuCCT1 cells treated with CHIR99021 or DMSO for 24 h. (G) Colony formation assay in control or LINC00313 over-expressing HuCCT1 cells, treated with CHIR99021 or XAV939 or DMSO for 24 h. Quantification of the number of colonies for each condition is also shown. (H) Real-time qPCR analysis of AXIN2, TCF7 and LINC00313 expression in control or LINC00313 overexpressing HuCCT1 cells, treated with CHIR99021, XAV939, or DMSO for 24 h. Data information: In panel (B) data are presented as mean ± SD (n = 3 biological replicates). In panel (F) data are presented as mean ± SD (n = 6 biological replicates). **P ≤ 0.01, ***P ≤ 0.001 (Student’s t-test). In panels (G) and (H) data are presented as mean ± SD (n = 3 biological replicates). *P ≤ 0.05, **P ≤ 0.01, ***P ≤ 0.001 (Student’s t-test). Source data are available online for this figure.

