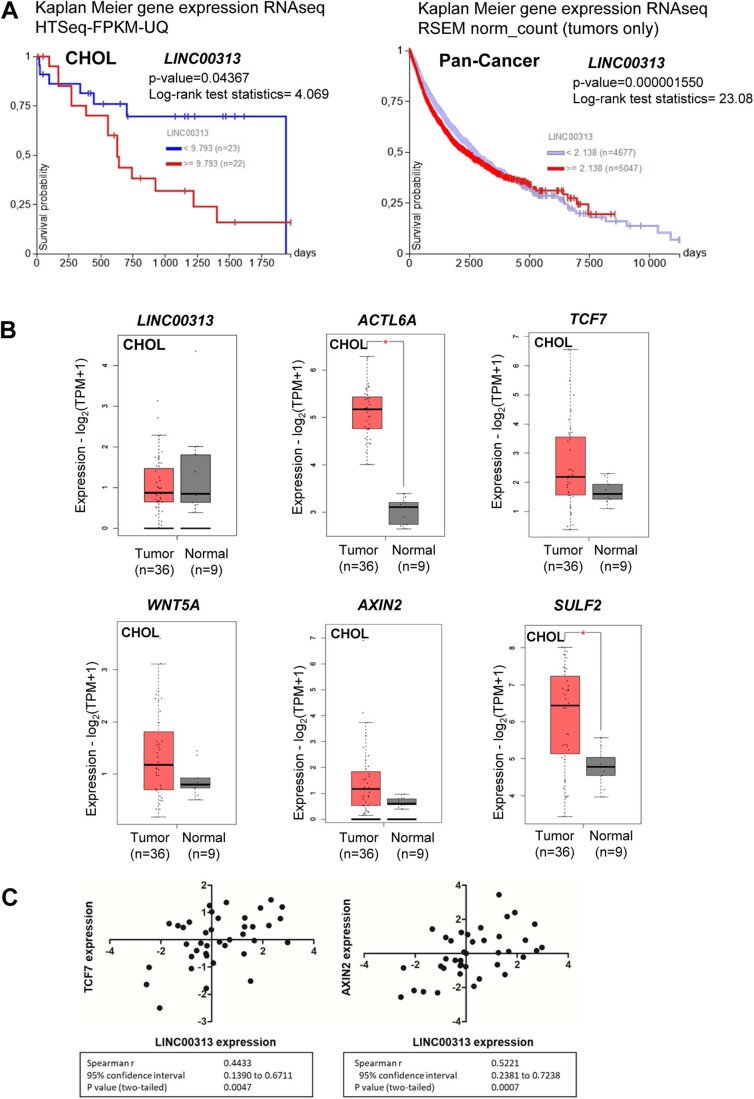
Figure EV5. Clinical relevance of LINC00313 in CCA.
(A) Kaplan Meier curves depicting overall survival in CHOL patients and Pan-Cancer patients grouped based on LINC00313 median expression, using the Xena Functional Genomics Explorer from the UCSC. (B) Boxplots of LINC00313, ACTL6A, TCF7, WNT5A, AXIN2 and SULF2 transcripts per million (TPMs) in cholangiocarcinoma (CHOL) tumours (n = 36) and their paired normal tissues (n = 9), using GEPIA2. *p < 0.01. (C) Expression correlation of LINC00313 with TCF7 and AXIN2 in a cohort of 39 iCCA patients p < 0.05. Data information: In panel (A), log-rank test was used to compare the different Kaplan–Meier curves. In panel (B), transcript expression is shown in logarithmic scale and the method for differential analysis is one-way ANOVA, using disease state (tumour vs normal) as variable for calculating differential expression. The log2FC cut-off equals 1 and the p-value cut-off equals 0.01. In panel (C) a two-tailed Student’s t-test was used to calculate p-values.

