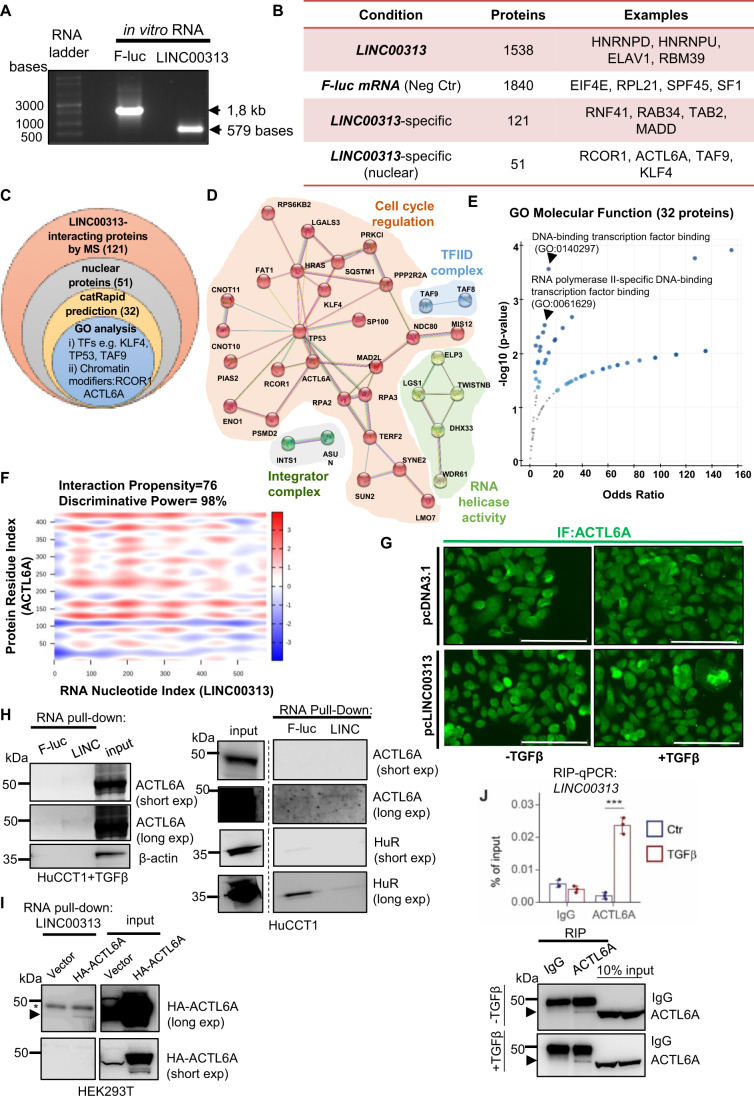
Figure 6. ACTL6A interacts with LINC00313 transcripts.
(A) In vitro transcribed F-luc and LINC00313 RNAs. (B) Overview of interacting proteins identified by mass spectrometry. (C) Venn diagram representing the strategy to narrow down LINC0313-binding proteins. (D) Protein network analysis depicting physical and functional interactions between the 51 nuclear interactors, using STRING. (E) GO analysis for molecular function of 32 nuclear interactors predicted by CatRAPID. (F) Heatmap depicting the probability of interaction between LINC00313 and ACTL6A. (G) Immunofluorescence of ACTL6A in control or LINC00313 over-expressing HuCCT1 cells, treated or not with TGFβ1. Scale bars: 150 μm. (H) RNA pull-down assays in HuCCT1 cells, stimulated with TGFβ1 or not, using in vitro synthesized F-luc mRNA or LINC00313 lncRNA, followed by immunoblotting for ACTL6A, HuR and β-actin. (I) RNA pull-down assay in HEK293T cells, over-expressing an empty vector or HA-tagged ACTL6A using in vitro synthesized LINC00313 lncRNA. An arrow depicts the specific HA-ACTL6A protein band, while an asterisk marks unspecific protein bands. (J) RIP assay for endogenous ACTL6A followed by qPCR for LINC00313 in HuCCT1 cells treated with TGFβ or BSA/HCl (vehicle control) for 16 h (n = 3). An immunoblotting to verify the efficiency of ACTL6A immunoprecipitation is also shown. The arrows depict the specific endogenous ACTL6A protein bands. Data information: In panel J RIP-qPCR data are presented as mean ± SD (n = 3 technical replicates). Source data are available online for this figure.

