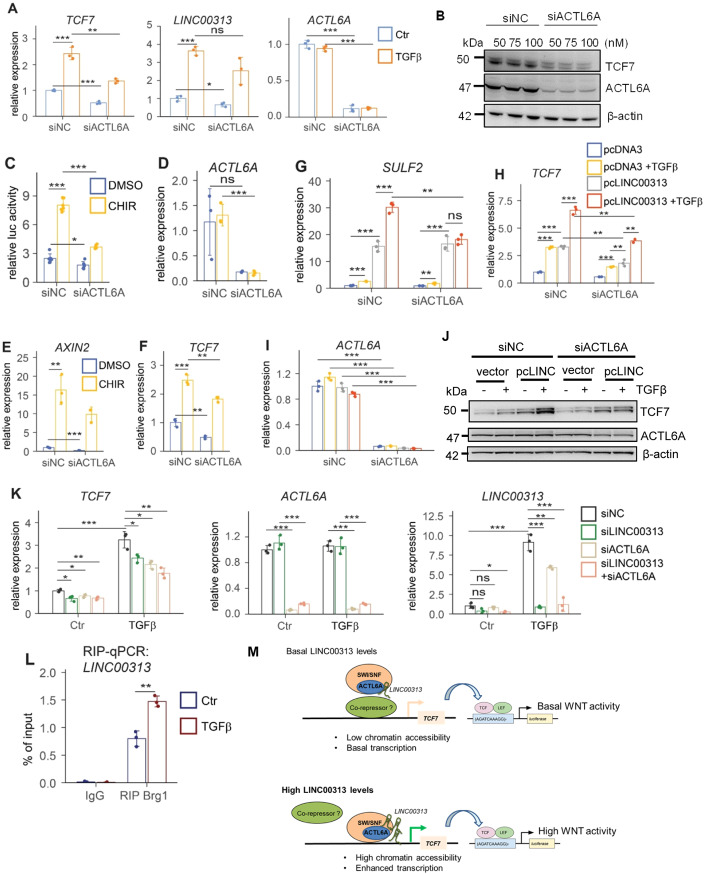
Figure 7. ACTL6A silencing reduces TCF/LEF-mediated gene expression.
(A) TCF7, LINC00313 and ACTL6A mRNA levels in HuCCT1 transfected with siACTL6A or siNC and in the presence or not of TGFβ. (B) Immunoblotting for TCF7, ACTL6A and β-actin, upon silencing ACTL6A, using the indicated siRNA concentrations. (C) TCF/LEF luciferase reporter assay in siACTL6A or siNC HuCCT1 cells treated with CHIR99021 or DMSO for 24 h. (D–F) qPCR analysis of ACTL6A (D), AXIN2 (E) and TCF7 (F) mRNAs in the same conditions as these of panel (C). (G–I) qPCR analysis of SULF2 (G), TCF7 (H) and ACTL6A (I) mRNA levels in pcDNA3 or LINC00313 over-expressing HuCCT1 transiently transfected with siACTL6A or siNC with or without TGFβ. (J) Immunoblotting for TCF7, ACTL6A and β-actin in the same conditions as these of panels G-I. (K) qPCR analysis of TCF7, ACTL6A and LINC00313 RNA levels in HuCCT1 cells transiently transfected with siRNAs against LINC00313 or ACTL6A individually or simultaneously with both siRNAs and treated or not with TGFβ for 16 h. (L) RIP assay for endogenous Brg1 followed by qPCR for LINC00313 in HuCCT1 cells treated with TGFβ or BSA/HCl (vehicle control) for 16 h. (M) Proposed model for the molecular mechanism of LINC00313. Data information: In panels (A), (D–I) and (K) qPCR data are presented as mean ± SD (n = 3 biological replicates). In panel (C), luciferase assay data are presented as mean ± SD (n = 6 biological replicates). In panel (L), RIP-qPCR data are presented as mean ± SD (n = 3 technical replicates). *P ≤ 0.05, **P ≤ 0.01, ***P ≤ 0.001 (Student’s t-test). Source data are available online for this figure.

